
We're net positive for 2013!

Year Summary
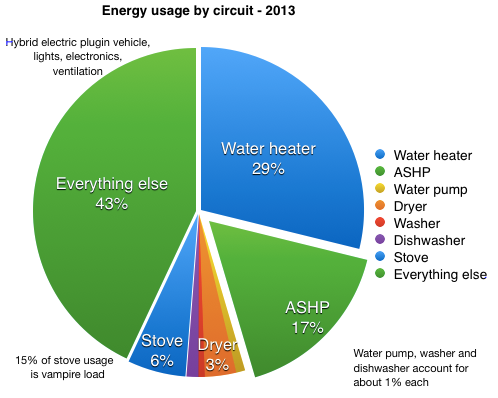
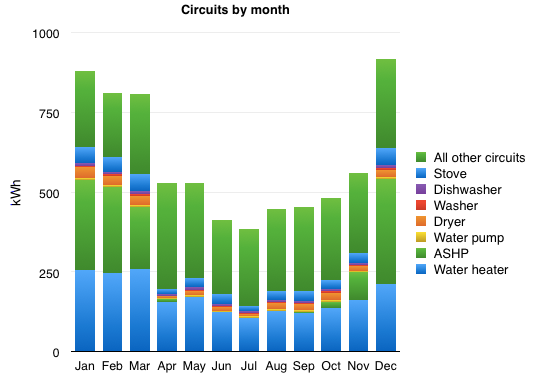
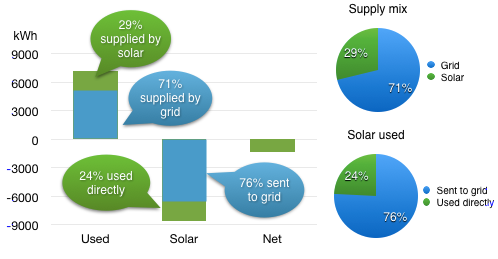
We’re net positive for 2013! We used 7,206 kWh and generated 8,575 kWh for a net surplus of 1,368 kWh. We used an average of 19.7 kWh per day. We used 29% more energy and generated 3% less than last year. 2013 was 16% cooler than 2012. The coldest day of 2013 was Jan 3 at -7 degrees F, and the coldest day overall was Jan 24 at 60.8 HHD.
We’re 21% over our projected energy use of 5,950 kWh for the year. We used about 85% of the estimated 2,440 kWh for hot water energy. We used 26% of our heat energy estimate for the year.
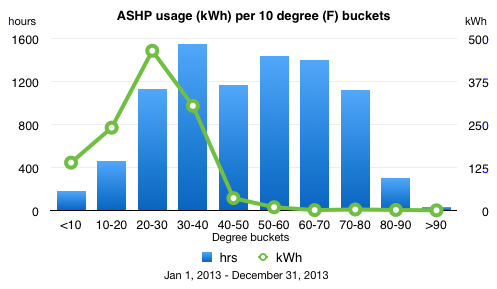
Our BTU/SF/HDD is 0.425. BTU/SF/HDD is a common measure to compare the efficiency of houses of different sizes and climates. We recorded 6,810 HDD (base 65F) for 2013. The ASHP used 1195.782 kWh for heating in that period. Converting kWh to BTUs, 1195.782 kWh * 3,412.14163 (kWh to BTU conversion factor) then divide by 1408 SF and divide again by 6,810 HDD = 0.425.
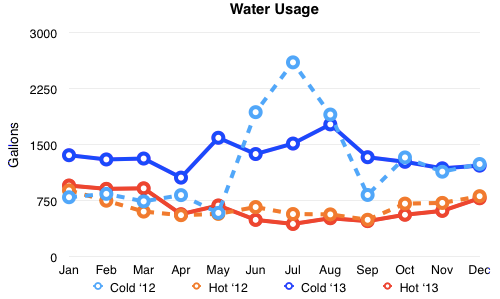
We used an average of 66 gallons of water per day. 33% of our total water usage was hot water. It takes about 264 watts to heat each gallon of hot water and 2.644 watts to pump it from the well.
That’s it for 2013. Happy 2014 everyone!

Categories
- Air sealing 13
- Appliances & Fixtures 4
- Art 3
- Award 4
- Bathroom 8
- Batteries 1
- Decor 5
- Design 10
- Electrical 5
- Energy Calculations 13
- Energy Monitors 4
- Farm 1
- Finance 1
- Flooring 3
- Foundation 9
- Framing 8
- Heating 9
- House 7
- Insulation 8
- Kitchen 6
- Landscaping 3
- Lessons Learned 1
- Performance 60
- Plumbing 10
- Porch 5
- Radon 1
- Rainwater catchment 3
- Research / study 1
- Roof 7
- Septic / Waste water 2
- Sheetrock 6
- Siding 9
- Site Work 22
- Smart home 1
- Solar 64
- Solar Obsessed 10
- Stairs 2
- Surveying 3
- Ventilation 8
- Weather 1
- Windows & Doors 14
- plug-in 3
Archive
- Jan 2021 1
- Dec 2020 2
- May 2020 1
- Jan 2020 1
- May 2019 1
- Jan 2019 3
- Sep 2018 2
- Aug 2018 2
- Jan 2018 1
- Oct 2017 2
- Apr 2017 1
- Jan 2017 1
- Oct 2016 2
- Aug 2016 1
- Apr 2016 2
- Jan 2016 2
- Nov 2015 2
- Oct 2015 1
- Jul 2015 1
- May 2015 1
- Apr 2015 1
- Jan 2015 1
- Dec 2014 1
- Nov 2014 2
- Oct 2014 4
- Sep 2014 2
- Aug 2014 1
- Jul 2014 1
- Mar 2014 3
- Feb 2014 2
- Jan 2014 2
- Nov 2013 1
- Oct 2013 1
- Sep 2013 1
- Jul 2013 3
- Apr 2013 3
- Jan 2013 3
- Dec 2012 2
- Nov 2012 3
- Oct 2012 1
- Sep 2012 3
- Aug 2012 3
- Jul 2012 2
- Jun 2012 1
- May 2012 3
- Apr 2012 2
- Mar 2012 4
- Feb 2012 4
- Jan 2012 5
- Dec 2011 4
- Nov 2011 9
- Oct 2011 10
- Sep 2011 9
- Aug 2011 6
- Jul 2011 6
- Jun 2011 12
- May 2011 8
- Apr 2011 4
- Mar 2011 5
- Jan 2011 6
- Dec 2010 9
- Nov 2010 3
- Oct 2010 4
- Sep 2010 6
- Aug 2010 8
- Jul 2010 6
- Jun 2010 3
- May 2010 3
- Apr 2010 1
- Mar 2010 3
- Feb 2010 3
- Dec 2009 1
- Jun 2009 1
- May 2009 1
- Feb 2009 1
- Dec 2008 1
- Nov 2008 1
- Jun 2008 1