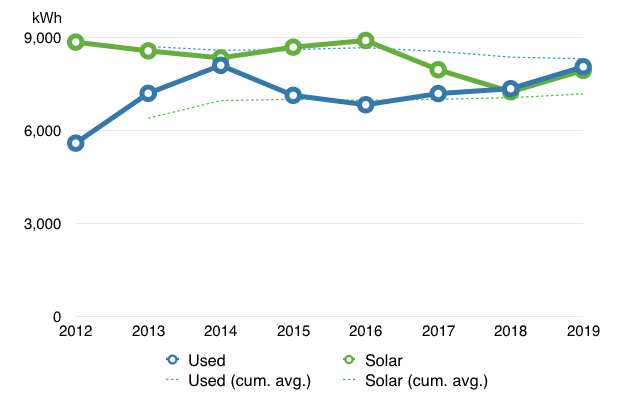
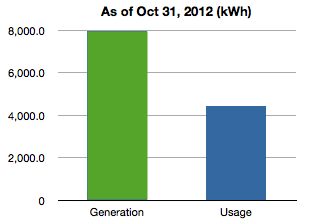
We used 7,921 kWh and generated 8,143 kWh for a net of 223 kWh for the year.
This is part of our quarterly home performance reporting. All data is posted at netplusdesign.com
Note: I’m 11 months behind in finishing this update. Back dating the post to January 4 when I started it.
It was very close. After 2 years of missing our target by roughly 100 kWh, it feels good to be back
in positive territory.
This was the first year of Covid so I was interested to see if there were any pattern shifts. You could say I’ve been exercising a hybrid work style ever since we moved out of the city. Some years I worked in the office more, others less. Jill continued to work at an office till a few years ago.
So were there any noticeable changes? Maybe a slight uptick in stove/oven usage. I do recall Jill doing a bit more baking as did the nation which is how we had a flour shortage. And the refrigerator usage was up a bit. But otherwise, no big changes.
2020 was our 3rd highest energy usage year and our 6th highest solar generation year.
2020 summary: 11% warmer, 2% less usage and 2% more sun
Here’s our progress for the first 9 years in the house. Yes, 9 years. You know what that means? I’m planning a 10 year house anniversary edition blog post for next year. Hopefully it won’t be 11 months late like this edition.
This will be a short edition as there were no big surprises that needed analysis.
Year summary: We used 8,062 kWh and generated 7,945 kWh for a net of -117 kWh for the year.
This is part of our quarterly home performance reporting. All data is posted at netplusdesign.com
Note: I’m 6 months behind in finishing this update. Back dating the post to January 4 when I statrted it.
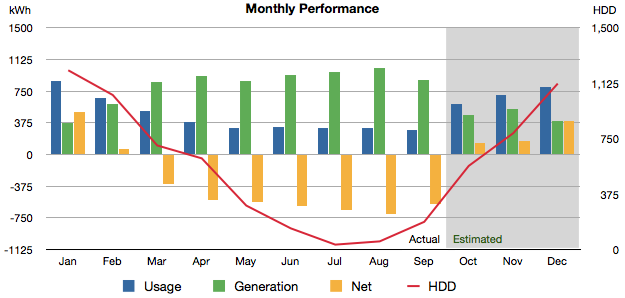
Last year we had relatively normal usage and rather low solar production. This year we have slightly less than normal solar, but higher usage. The end result is our second net overage in the lifetime of the house.
Chart showing solar and usage values for last 8 years
We produced 5% less solar than average, and used 14% more than average. That tipped the scales once again, just enough to push us into the negative zone. On the long view however, we’ve still generated a surplus of 9,040 kWh over the last 8 years since the house was built.
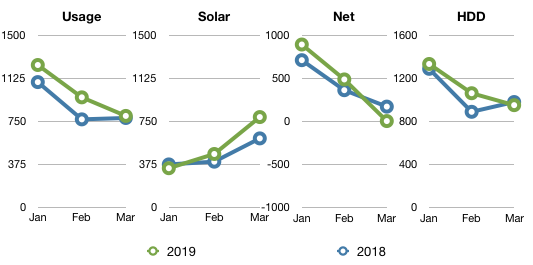
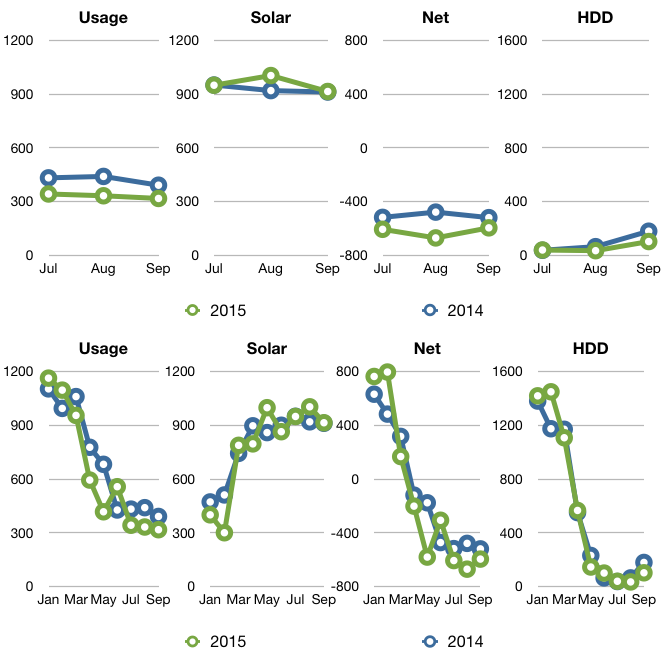
We were performing fairly normally until September. Let’s break down the numbers.
Q1 2019 summary: 6% colder, 14% more usage and 16% more sun as compared to Q1 2018.
This is part of our quarterly home performance reporting. All data is posted at netplusdesign.com
We recorded a low of -11.8 on January 22, far from our lowest recorded temperature of -17.3°F on February 14, 2016. Our high was 69.5, lower than the 77.6°F last year. In 2012 we recorded a high of 82.4°F in the same period.
Overall, here’s how this quarter compared to 2018.
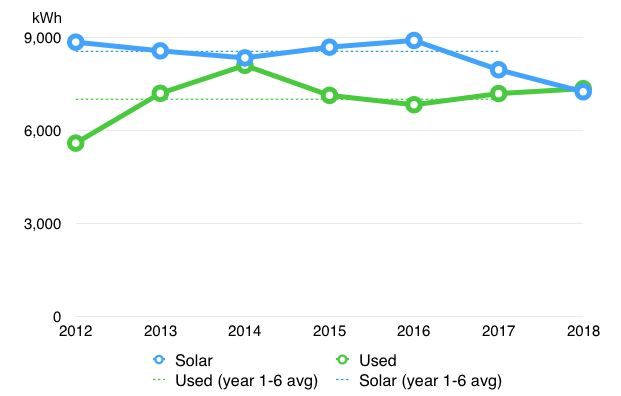
Year summary: We used 7,356 kWh and generated 7,256 kWh for a net of -100 kWh for the year.
This is part of our quarterly home performance reporting. All data is posted at netplusdesign.com
2018 is the first year we have not generated a solar surplus. In short, we produced 15% less solar than average, and used 5% more than average. That tipped the scales just enough to break our 6 year net zero running streak. On the long view however, we’ve generated a surplus of 9,157 kWh over the last 7 years since the house was built.
Chart showing solar and usage values for last 7 years
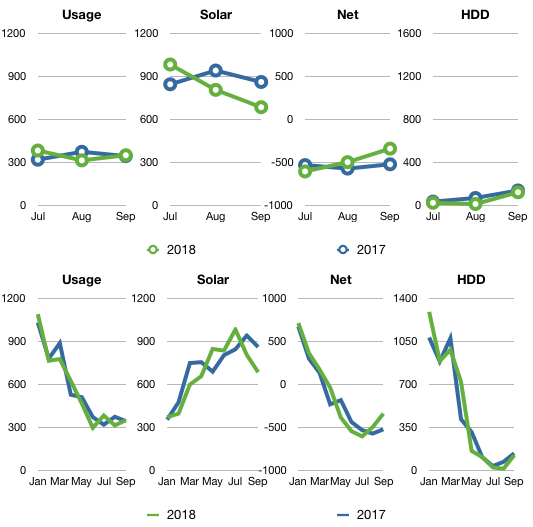
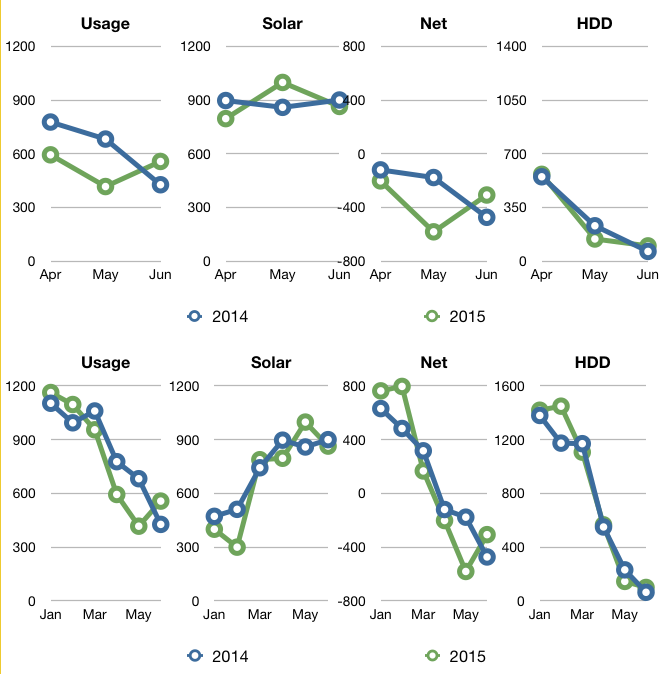
We were performing fairly normally until Q4. Let’s break down the numbers.
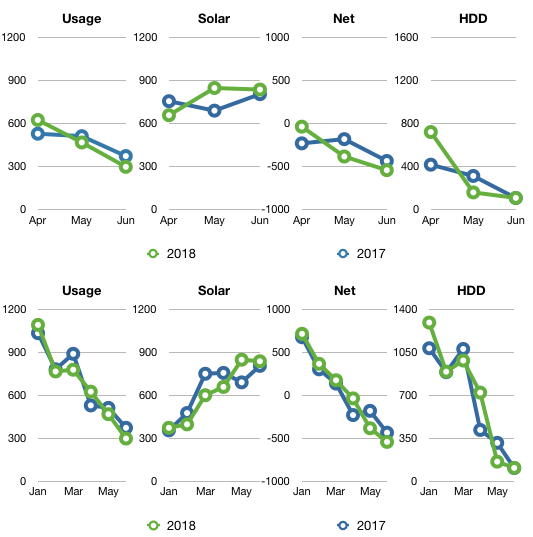
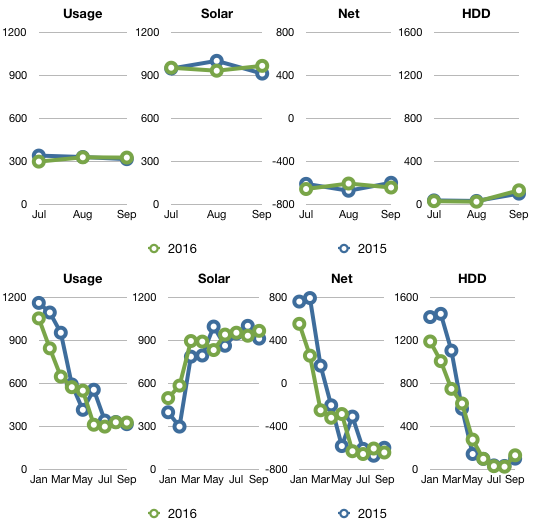
Q3 2018 summary: 33% warmer, 1% more usage and 7% less sun as compared to Q3 2017.
This is part of our quarterly home performance reporting. All data is posted at netplusdesign.com
Nothing exciting to report, which is normal for 3rd quarters.
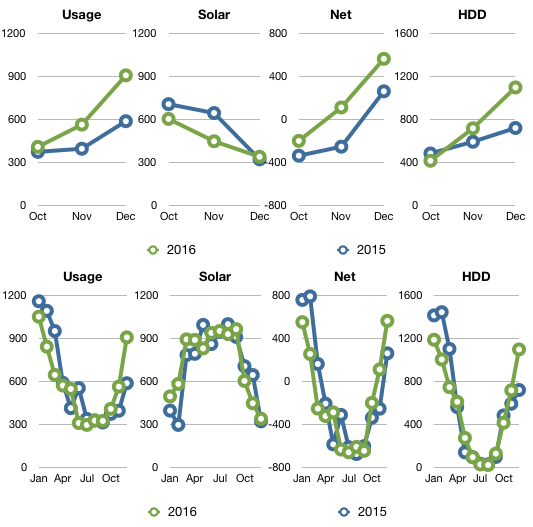
At 7am on July 15th we became net positive for the year. As of the end of September, we have a surplus of 1,115 kWh heading into the final months of 2018. That’s about 211 less kWhs than last year at this time. Overall for the year, our solar production is down about 7%.
Overall, here’s how this quarter compared to 2017.
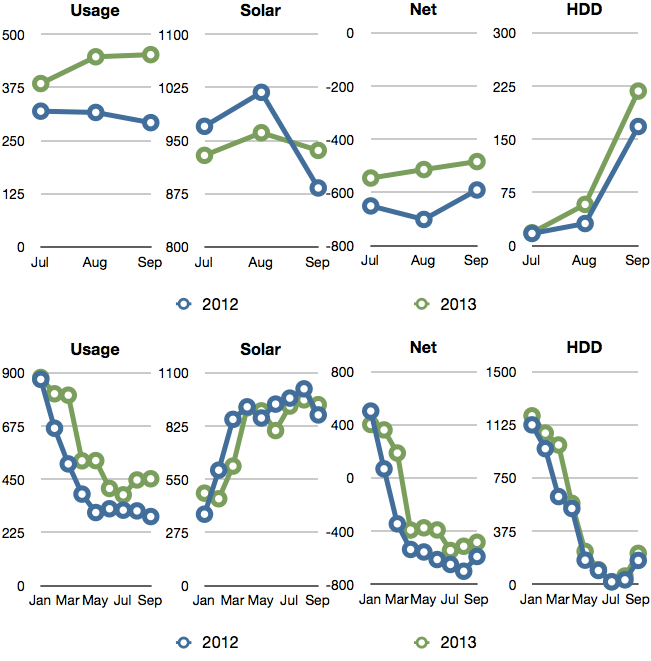
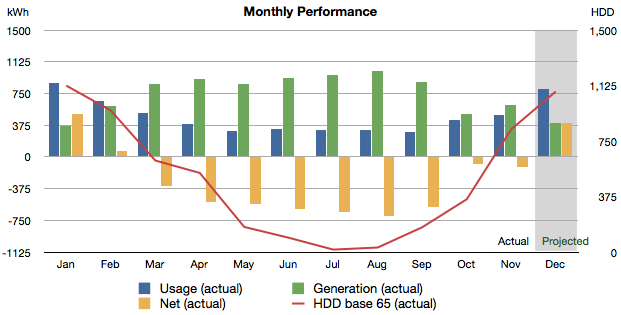
Chart showing usage, solar, net and hddRead more...
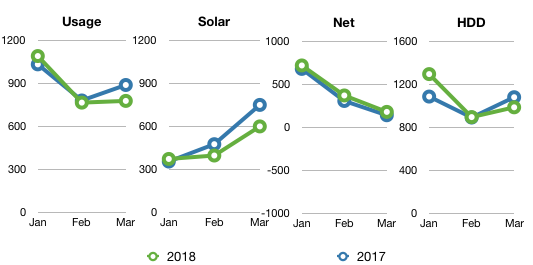
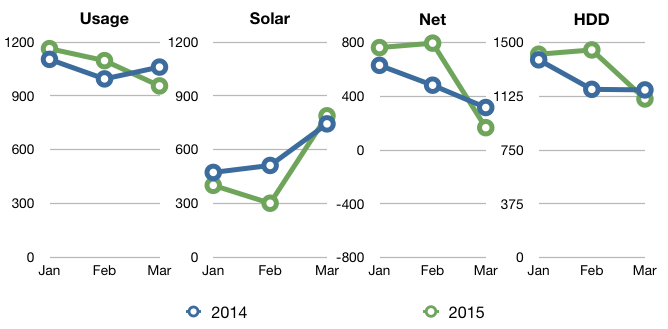
Q1 2018 summary: 4% colder, 3% less usage and 13% less sun as compared to Q1 2017.
This is part of our quarterly home performance reporting. All data is posted at netplusdesign.com
I said it last year and I’ll say it again, it was a whacky winter. Lots of cold days, but also lots of warm days. It would be warm for a week or two, the ground would thaw, then we’d get snow.
We recorded a low of -17.1 on January 7, close to our lowest recorded temperature of -17.3°F on February 14, 2016. Our high was 77.6, higher than the 73.6°F last year. In 2012 we recorded a high of 82.4°F in the same period.
Overall, here’s how this quarter compared to 2017.
We used 7,198 kWh and generated 7,966 kWh for a net of 769 kWh for the year.
This is part of our quarterly home performance reporting. All data is posted at netplusdesign.com
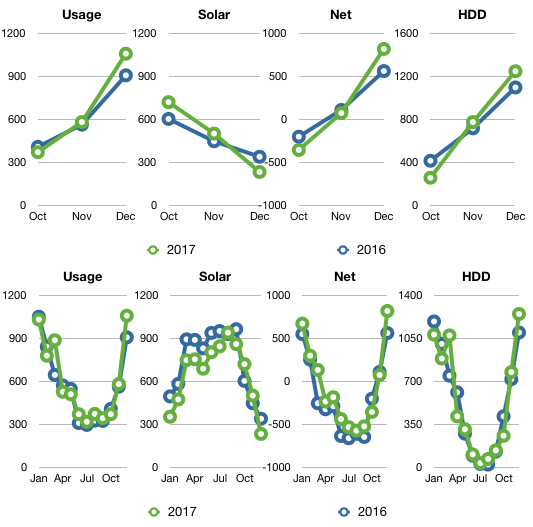
2016 was our second highest net energy surplus year after 2012 and our highest solar generation year.
2017 was our second lowest net energy surplus year after 2014 and our lowest solar generation year over the last 6 years. We had a lot of cloudy days and snow covered panels.
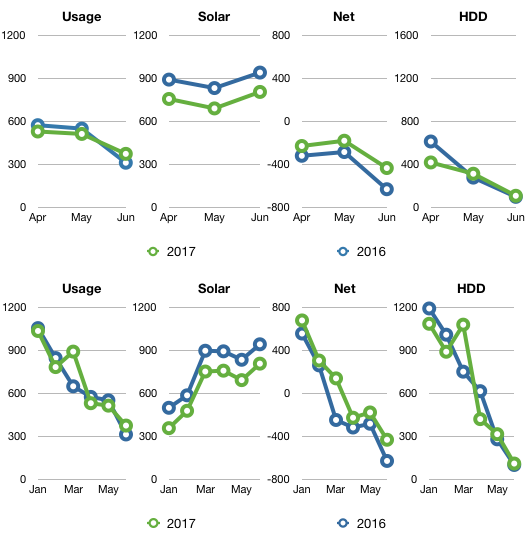
Q4 2017 summary: 2% colder, 7% more usage and 5% more sun as compared to Q4 2016.
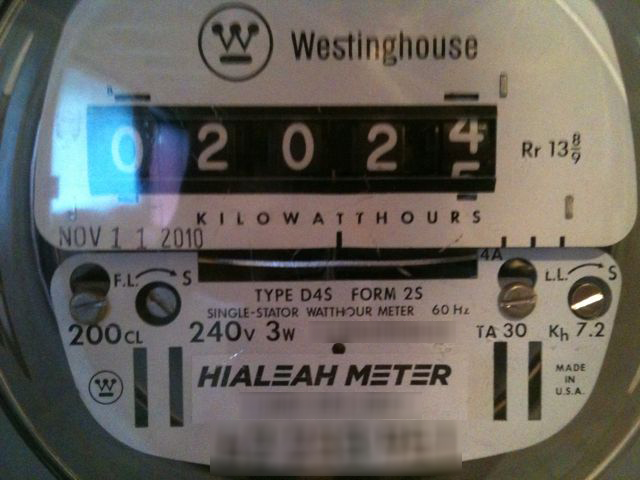
In Q4 our total usage was 2,022 kWh, a 7% increase from our 1,890 kWh in 2016. We also generated 65 kWh more solar.
Overall, here’s how this quarter and the year compare.
Charts comparing Q4 and YOY usage, solar and HDDRead more...
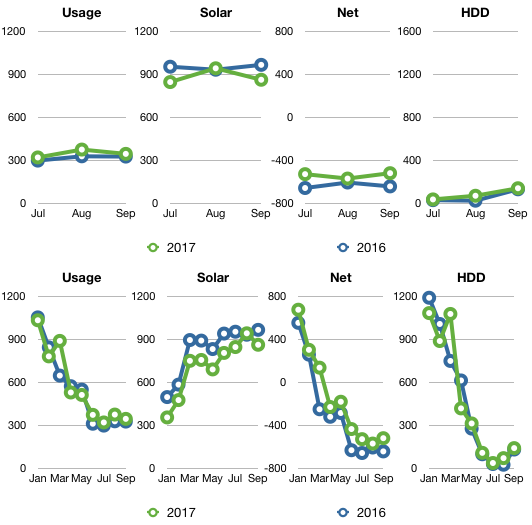
Q3 2017 summary: 33% cooler, 9% more usage and 7% less sun as compared to Q3 2016.
This is part of our quarterly home performance reporting. All data is posted at netplusdesign.com
Nothing exciting to report, which is normal for 3rd quarters.
At 1pm on July 17th we became net positive for the year. As of the end of September, we have a surplus of 1,326 kWh heading into the final months of 2017. That’s about 574 less kWhs than last year at this time. Overall for the year, our solar production is down about 13%.
Overall, here’s how this quarter compared to 2016.
Chart showing usage, solar, net and hddRead more...
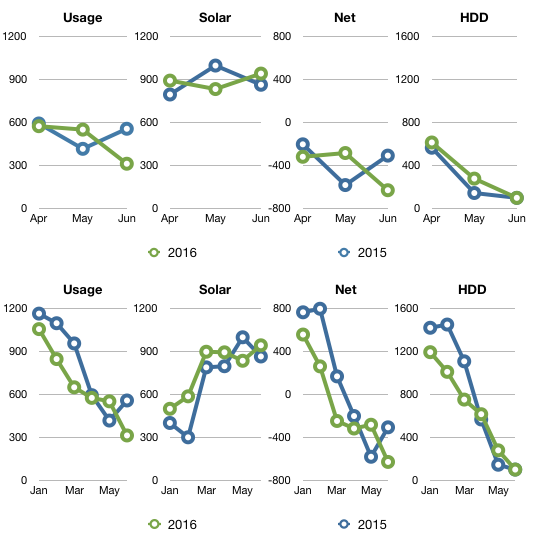
Q1 2017 summary: 3% colder, 6% more usage and 20% less sun as compared to Q1 2016.
This is part of our quarterly home performance reporting. All data is posted at netplusdesign.com
I’ll say it, it was a whacky winter. Lots of cold days, but also lots of warm days. It would be warm for a week or two, the ground would thaw, then we’d get snow.
We recorded a low of 3.3, quite a bit warmer than the -17.3°F last year’s low. Our high was 73.6, less than the 78.5°F last year. In 2012 we recorded a high of 82.4°F in the same period.
Overall, here’s how this quarter compared to 2016.
Q3 2016 summary: 10% cooler, 3% less usage and about the same amount of sun as compared to Q3 2015.
This is part of our quarterly home performance reporting. All data is posted at netplusdesign.com
Nothing exciting to report, which is normal for 3rd quarters.
At 7am on May 31st we became net positive for the year. As of the end of September, we have a surplus of 1,900 kWh heading into the final months of 2016.
Overall, here’s how this quarter compared to 2015.
Chart showing usage, solar, net and hddRead more...
Q1 2016 summary: 26% warmer, 21% less usage and 33% more sun as compared to Q1 2015.
This is part of our quarterly home performance reporting. All data is posted at netplusdesign.com
Although it seemed a lot warmer this winter, 1,023 less heating degree days than Q1 2015, it was still 9% cooler than first quarter 2012 which is the warmest winter since we began recording temperature data.
Despite it being warmer this winter, we recorded a low of -17.3°F, 1.2 degrees colder than last year’s low. Our high was 78.5°F which was considerably warmer than last year’s high of 52.8, but lower than 2012 when we recorded a high of 82.4°F.
Overall, here’s how this quarter compared to 2015.
Chart showing usage, solar, net and hdd for Q1 2016Read more...
This is part of our quarterly home performance reporting. All data is posted at netplusdesign.com
We used 7,141 kWh and generated 8,694 kWh for a net of 1,552 kWh for the year. This is our second highest net energy year after 2012. Here’s our progress for the first 4 years in the house.
All values in kWh (except HDD which is base 65°F).
Q3 2015 summary: 38% warmer, 22% less usage and 3% more sun as compared to Q3 2014.
This is part of our quarterly home performance reporting. All data is posted at netplusdesign.com
Traditionally, 3rd quarters are pretty boring in the home performance category. No heating. Generally no air conditioning. No ventilator because the windows are open. At this time of year, the main job of the house is to keep the rain out, and we didn’t get much of that this quarter.
Our most exciting finding this quarter was that we had a 1+ megawatt month. In August we produced 1.003 MW. This is only the second time we’ve produced more than a megawatt in a single month. The first was August 2012 when we produced 1.018 MW.
Sometime in early August we became net positive for the year. We now have a surplus of 1,239 kWh heading into the final months of 2015.
Overall, here’s how this quarter compared to 2014.
Charts comparing Q3 usage, solar and HDDRead more...
Q2 2015 summary: 4% cooler, 17% less usage and 2kWh more sun as compared to Q2 2014.
This is part of our quarterly home performance reporting. All data is posted at netplusdesign.com
It is a wet, foggy and cold July 4th at Up Hill House. Perfect weather to update our quarterly numbers! And like today, this quarter was fairly uneventful. In energy terms, however, that is not a bad thing for us.
Overall, here’s how this quarter compared to 2014.
Charts comparing Q2 usage, solar and HDDRead more...
Q1 2015 summary: 7% cooler, 2% more usage and 14% less sun as compared to Q1 2014.
This is part of our quarterly home performance reporting. All data is posted at netplusdesign.com
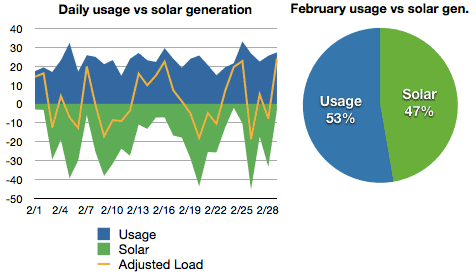
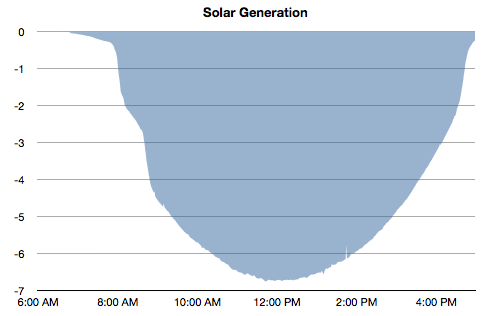
Although it seemed a lot colder this winter, it was really only 7% cooler than first quarter 2014. And considering there were many nights much colder than last year, -16°F versus -8°F last year, we only used 2% more energy. The biggest difference was snow cover, specifically the snow that covered our solar panels. This resulted in 14% less energy generated this quarter compared to last year, which means we netted out using 21% more energy from the power company.
Overall, here’s how this quarter compared to 2014.
Chart showing usage, solar, net and hdd for Q1 2015Read more...
This is part of our quarterly home performance reporting. All data is posted at netplusdesign.com
We used 8,108 kWh and generated 8,348 kWh for a net of 240 kWh for the year. The combination of cold temperatures, less sun and the plug-in Prius brought us close to our net point. Here’s our progress for our first 3 years in the house.
All values in kWh (except HDD which is base 65°F).
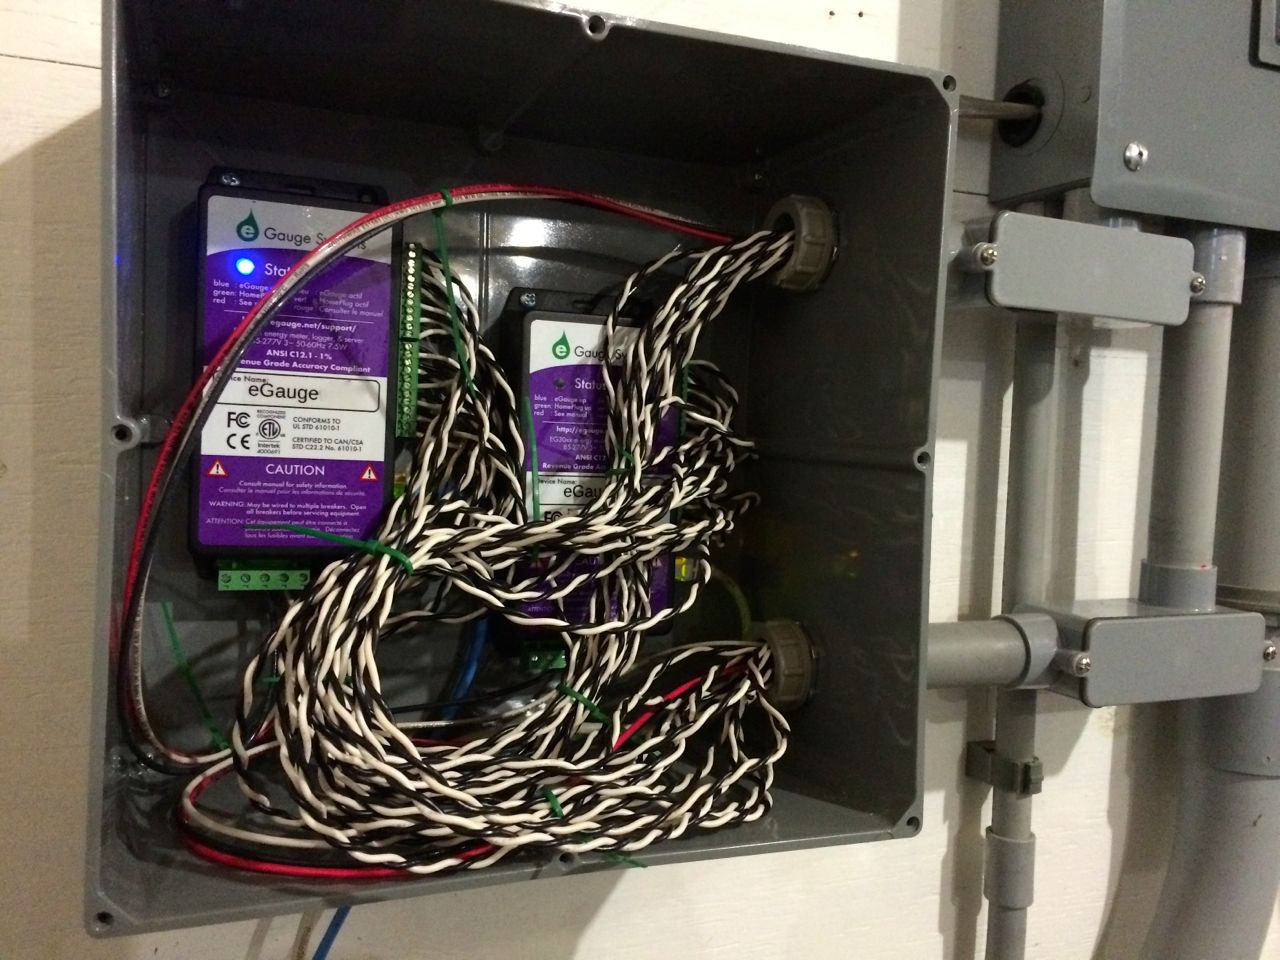
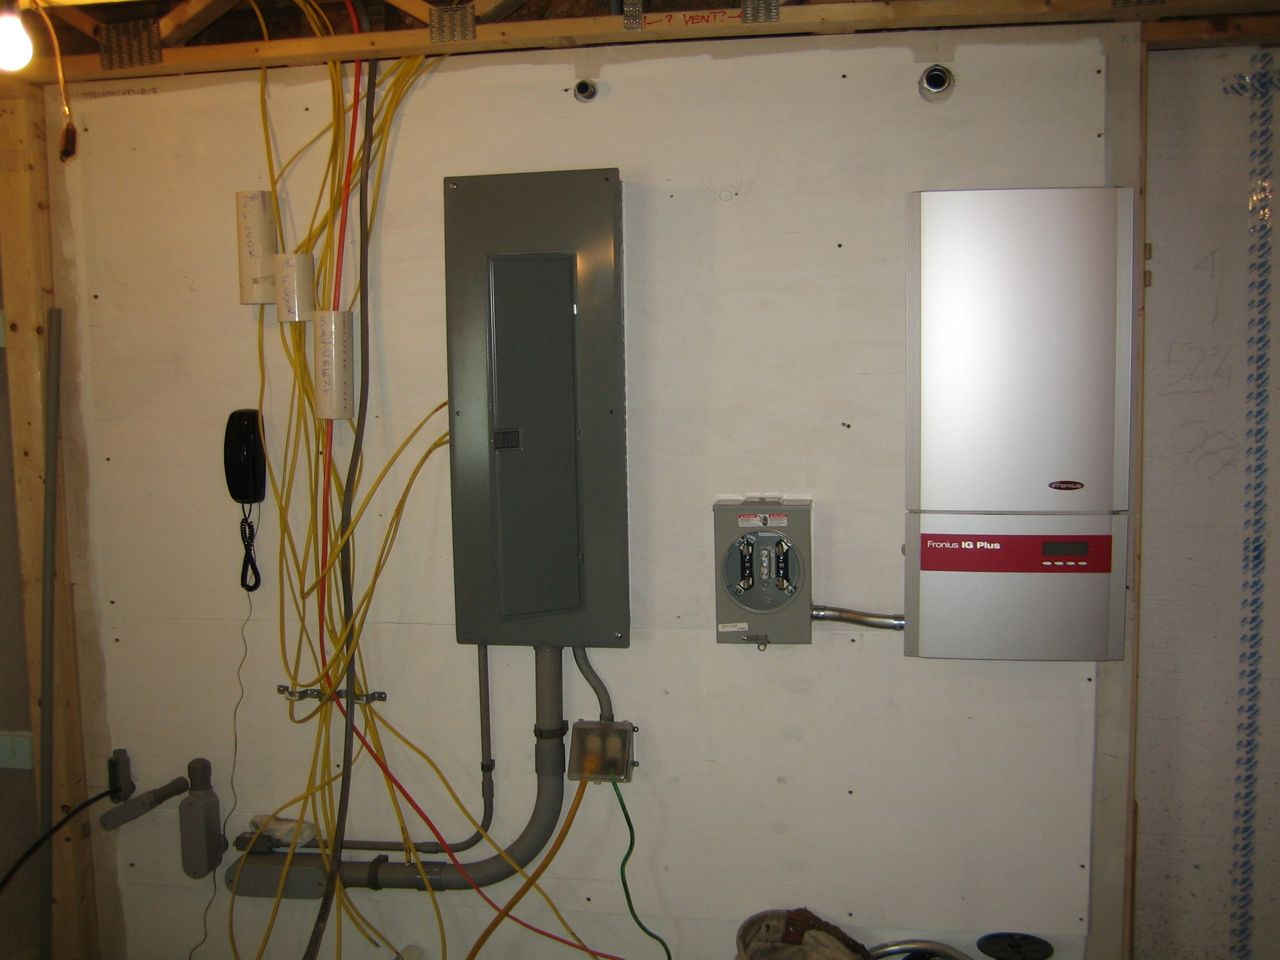
I’ve been slacking on the energy updates. I love my new energy monitor, but it broke my database update scripts and I haven’t had time to fix them. In the mean time I thought I’d share some high level updates.
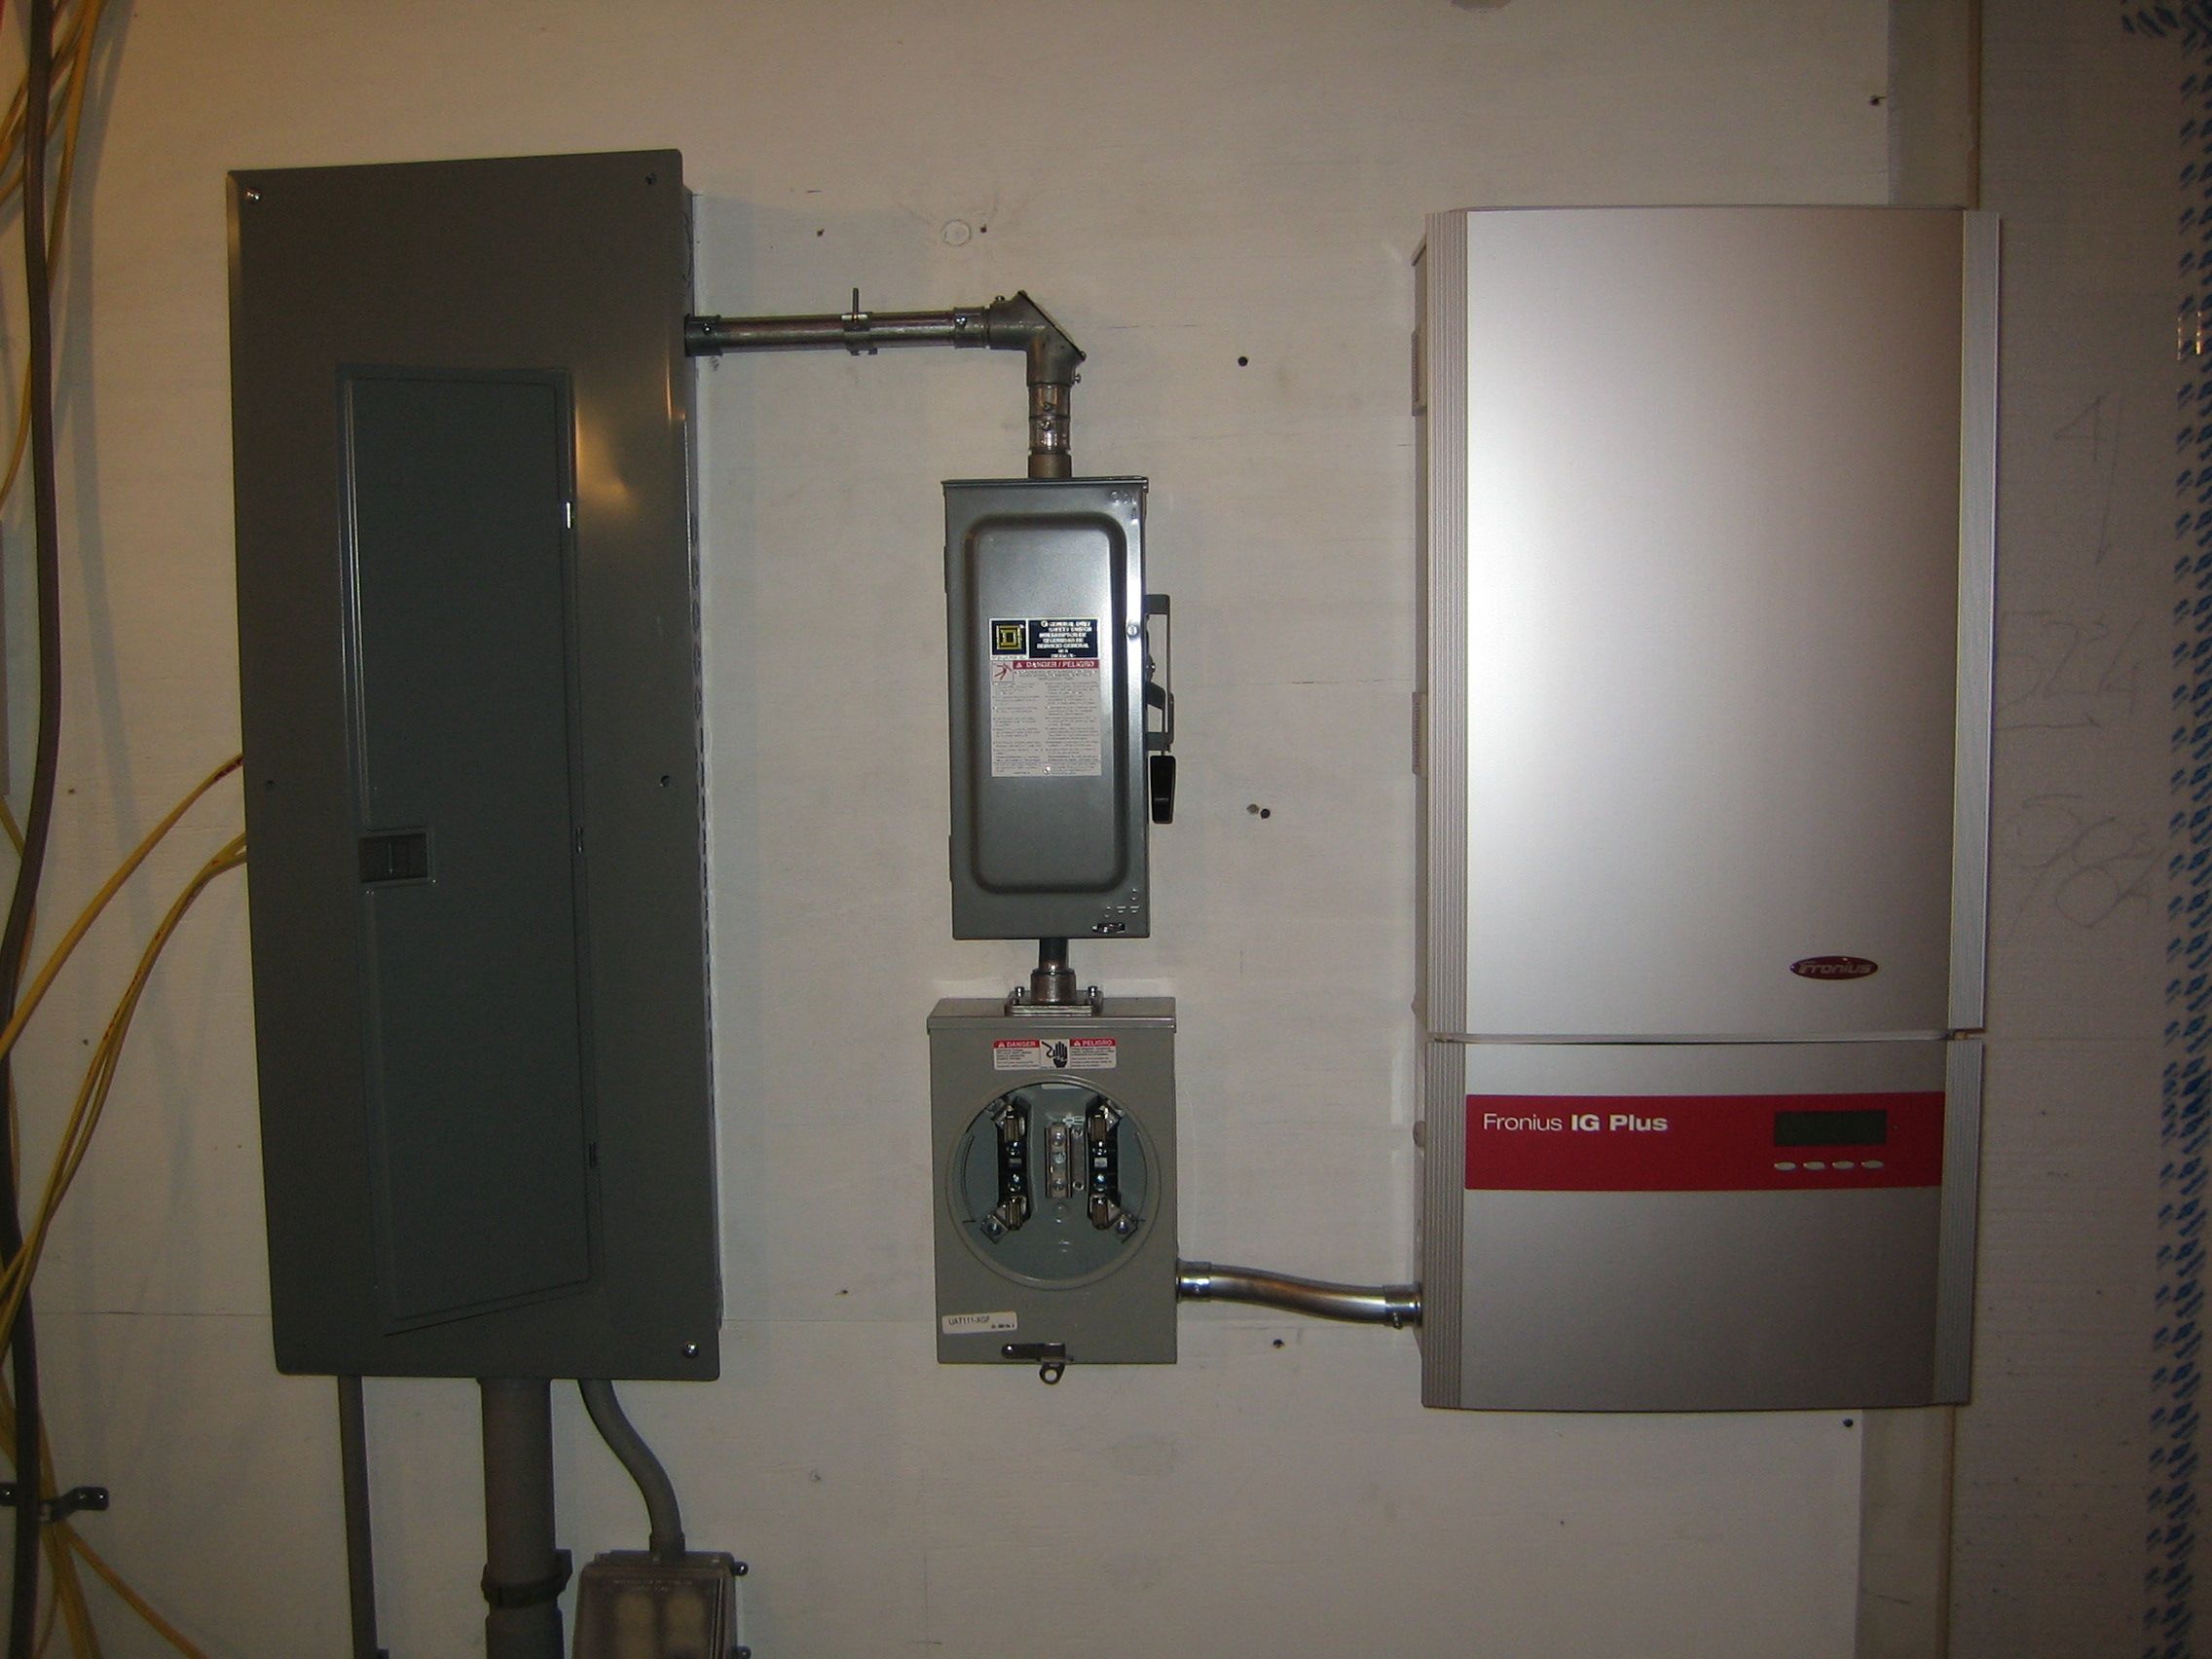
1. Transition from eMonitor to eGauge data begins March 8. Missing data for about 4 hours.
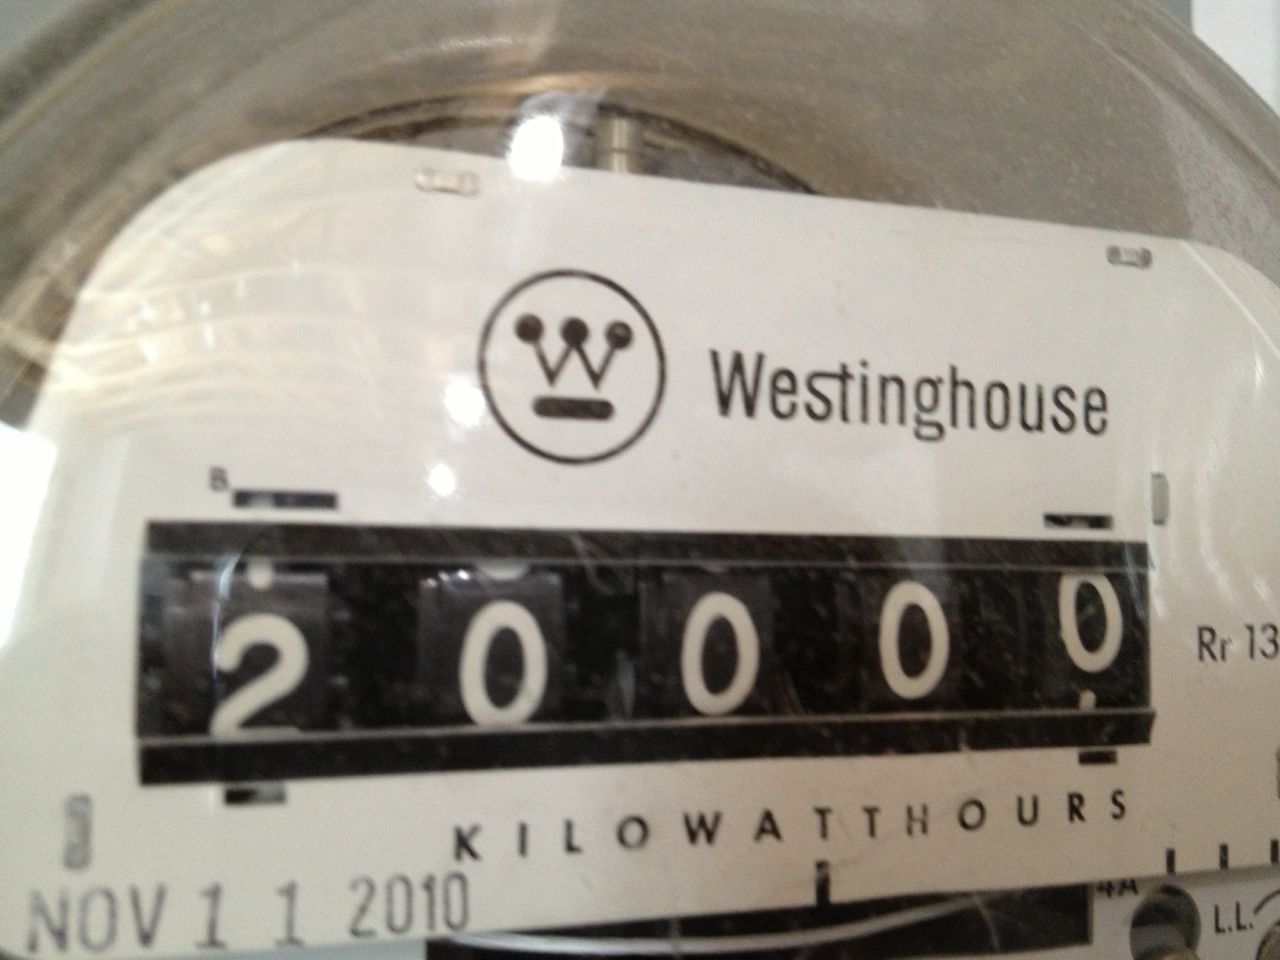
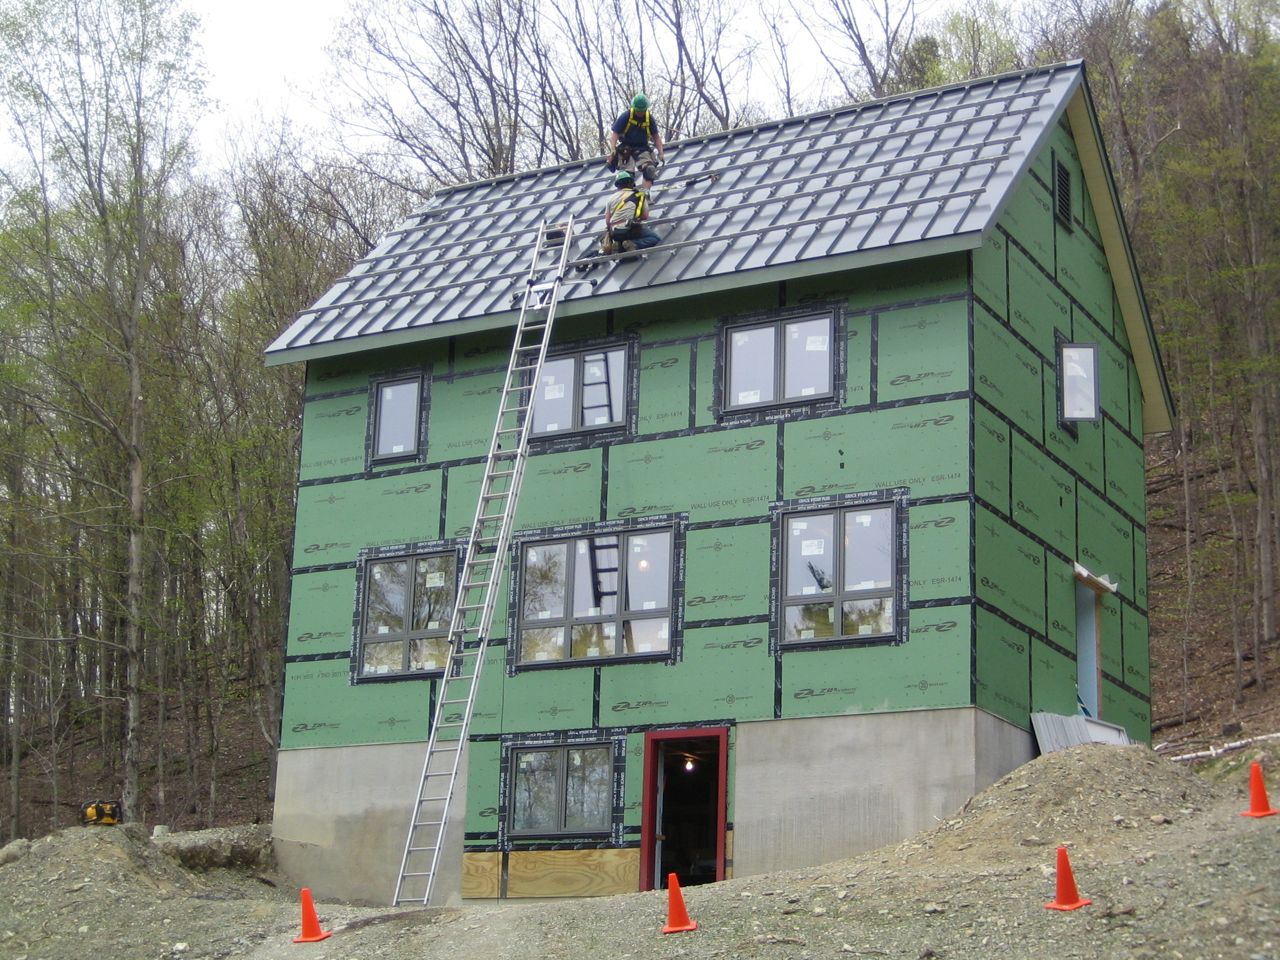
As you can see in the photo above, we have 2 new eGauges. Each monitors up to 12 circuits, for a total of 24. When you count 2 lines in, solar and several circuits that have double breakers pulling unbalanced loads, that ends up covering 20 individual things we can now monitor. We were previously monitoring only 7 circuits plus solar and power from the utility.
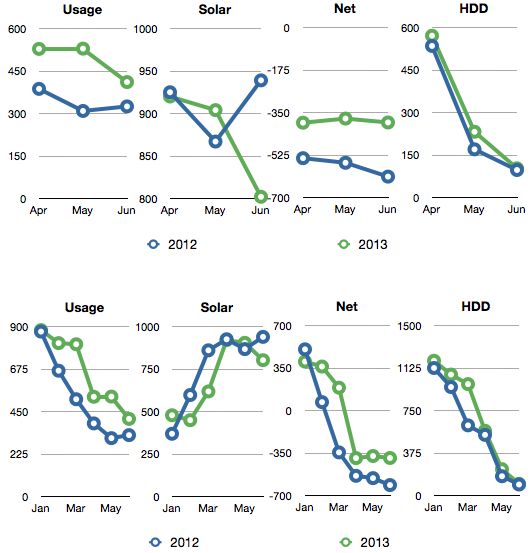
Q4 2013 summary: 10% cooler, 22% more usage and 10% more sun as compared to Q4 2012.
Now that we are starting to collect our second year of performance data, I’ll be comparing our new data to the same period last year. Year-over-year comparisons should be more illustrative than comparing to previous months. I’m also switching to a quarterly reporting period to look for larger trends, but I will continue to post data monthly at netplusdesign.com
In Q4 last year our total usage was 1,599 kWh. This year is was 1,957 kWh, a 22% increase. Despite snow covering the collectors for a few days and cloudy weather, we still produced 10% more energy in Q4.
Overall, here’s how this quarter and the year compare to 2012.
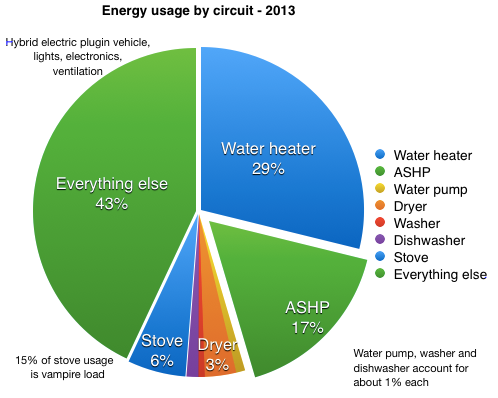
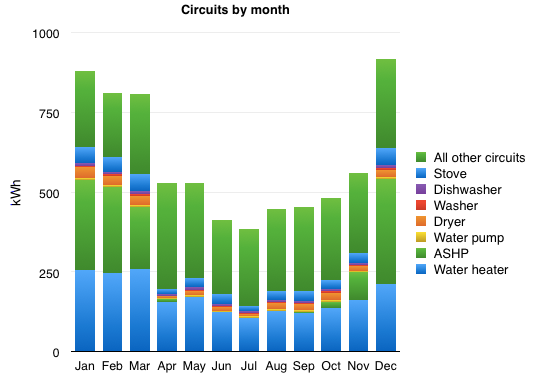
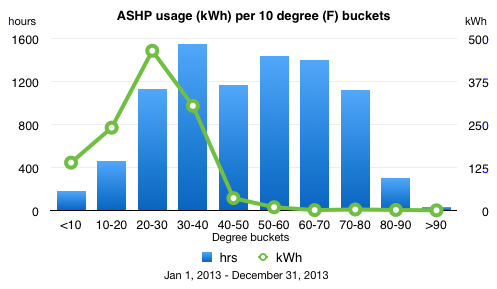
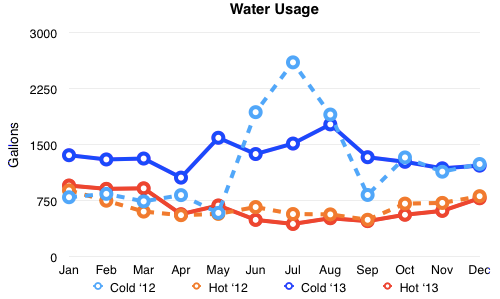
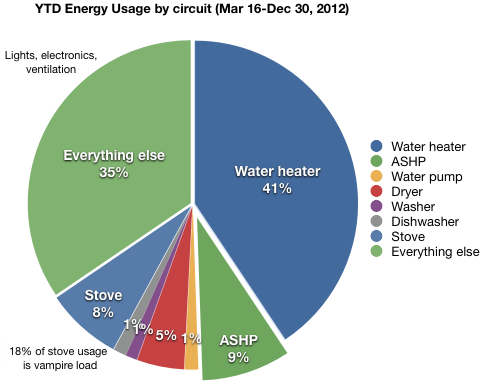
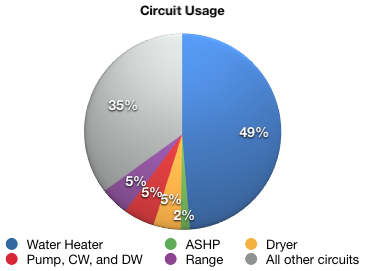
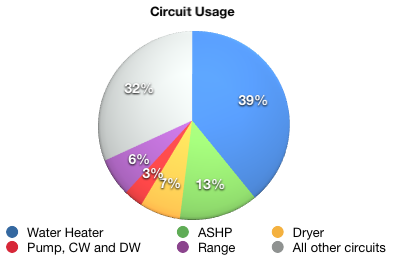
Pie chart of energy usage by circuit 2013Stacked bar chart of energy usage by month 2013Chart of monthly temperature ranges 2013Chart of temperature buckets with ASHP usage overlay 2013Chart of water usage 2013Read more...
Q3 2013 summary: 36% cooler, 38% more usage and 2% less sun as compared to Q3 2012.
Now that we are starting to collect our second year of performance data, I’ll be comparing our new data to the same period last year. Year-over-year comparisons should be more illustrative than comparing to previous months. I’m also switching to a quarterly reporting period to look for larger trends, but I will continue to post data monthly at netplusdesign.com
In Q3 last year our total usage was 927 kWh. This year is was 1,283 kWh, a 38% increase. Although it feels like it had rained a lot more this year then last, we only produced 2% less energy in Q3.
Overall, here’s how this quarter and the first three quarters compare to 2012.
Q2 2013 summary: 13% colder, 44% more usage and 4% less sun.
Now that we are starting to collect our second year of performance data, I’ll be comparing our new data to the same period last year. Year-over-year comparisons should be more illustrative than comparing to previous months. I’m also switching to a quarterly reporting period to look for larger trends, but I will continue to post data monthly at netplusdesign.com
In Q2 last year our total usage was 1,021 kWh. This year is was 1,468 kWh, a 44% increase. Although it feels like it had rained a lot more this year then last, we only produced 4% less energy in Q2.
Overall, here’s how the first and second quarters compare to 2012.
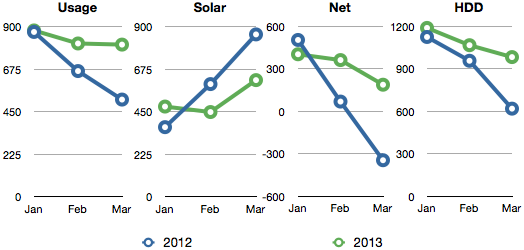
Q1 2013 summary: 20% more cold, 22% more usage and 15% less sun.
Now that we are starting to collect our second year of performance data, I’ll be comparing our new data to the same period last year. Year-over-year comparisons should be more illustrative than comparing to previous months. I’m also switching to a quarterly reporting period to look for larger trends, but I will continue to post data monthly at netplusdesign.com
In Q1 last year our net usage was 228 kWh. This year is was 953 kWh, a 300% increase! In March 2012 we actually generated a surplus, but not this year.
Overall, here’s how the first quarter compares to 2012.
Chart showing monthly usage, generation, net and hdd
We used 498 kWh and generated 615 kWh for a net surplus of 117 kWh in November. This is our ninth consecutive surplus month. We’ve generated a surplus of 3,622 kWh so far this year, guaranteeing we’ll be net positive for our first year of operation.
October was overshadowed by the events of the last week. Despite the best efforts of Hurricane Sandy we are safe and dry at Up Hill House. We had plenty of strong wind gusts, but not nearly as bad as the costal regions. We were prepared for the worst. We stocked up on water and easy to prepare meals. We have a small propane burner that can be used to heat water or simple cooking. We packed the chest freezer with ice. We filled the bathtub for flushing and the cistern was full for the farm critters. Thankfully the power never went out.
Fall weather arrived last month. More rain and clouds with cooler nights. We generated 883 kWh in September, down 15% from last month, but still about 37 kWh better than predicted. We generated on average 29.4 kWh per day.
We used 292 kWh, our lowest month yet. That’s down 7% from the previous month. We used the air conditioning only 2 days and heating for 1 day. We used 9.5 kWh for cooling / dehumidification, and 5.9 kWh for heating. Together that’s 5% of our month’s total usage. We generated a 591 kWh surplus this month, our 7th surplus month in a row.
I changed the format of the table a bit. Months now run down the table instead of across.
We generated 1,018 kWh in August, up 5% from last month. That is our best month yet, and our best daily average of 32.8 kWh per day as compared to the last two month’s average of 31.3 kWh per day. Typically solar generation starts to decline in August, with decreasing sunlight hours, more clouds and more heat, but not this year.
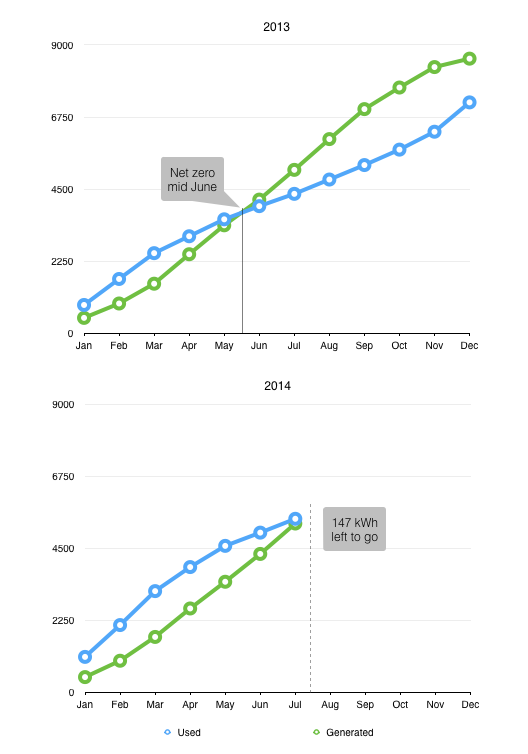
Back in our June performance update, we mentioned that June was our first year anniversary for our solar PV system. In New York, the utility keeps track of the amount of power we use and generate (net-metering) over the course of a year and on the anniversary date credits the owner with any surplus power generated. We generated a surplus of 3,650 kWh from June 1, 2011 to June 1, 2012.
After several calls to customer service and waiting 75 days, we finally got our credit from the power company.
We generated 970 kWh in July, up 3% from last month. That is our best month yet, but in line with last month’s daily average of 31.3 kWh. We used 319 kWh, 5% less per day on average than last month. We turned on the air conditioning for 3 days during a particularly humid run, and periodically for a few days the next week. We used 12 kWh for cooling / dehumidification, 8% of our month’s total usage. We generated a 651 kWh surplus this month, our 5th surplus month in a row and highest yet.
June seemed to be in line with past year averages at least temperature-wise. (1 heating degree day less than the 10 year average, 52% less HDD than May, 8% more sun). We turned on the air conditioning for a couple of hours on three particularly hot and humid days. We’ve also started building a barn this month so that is starting to show up in our energy usage. This partially resulted in 5% higher energy usage in June. We used 0.36 kWh for space heating and 2.76 kWh for cooling. Our daily average usage was up 9% from May. We generated a 614 kWh surplus this month, our forth surplus month in a row and highest yet.
May was a warm and rainy month. (52% less heating degree days than April, 7% less sun). This partially resulted in 20% lower energy usage in May. We only used 4.8 kWh for space heating. Our daily average usage was down 23% from April. We generated a 558 kWh surplus this month, our third surplus month in a row.
April saw the return of weather normalcy. (12% less heating degree days than March but only 8% less than the 10 year average, 7% more sun). This partially resulted in 25% lower energy usage in April. We used 49 kWh just for space heating. We also installed a clothes line outside and used the clothes dryer less this month. Our daily average usage was down 22% from March. We generated a 538 kWh surplus in April, our second surplus month in a row.
March madness, the weather that is. March was freakishly warm and much sunnier than February (33% less heating degree days, 31% more sun). This partially resulted in 23% lower energy usage in March. Our daily average usage was down 28% from February. We generated a 345 kWh surplus in March, the first since we moved in Jan 1st.
I’ve mentioned Solar Renewable Energy Credits in previous posts and comments. It’s a great way to shorten the payback period for solar producers and encourage more solar production. Also encourages power companies to purchase more renewable energy from the little guy.
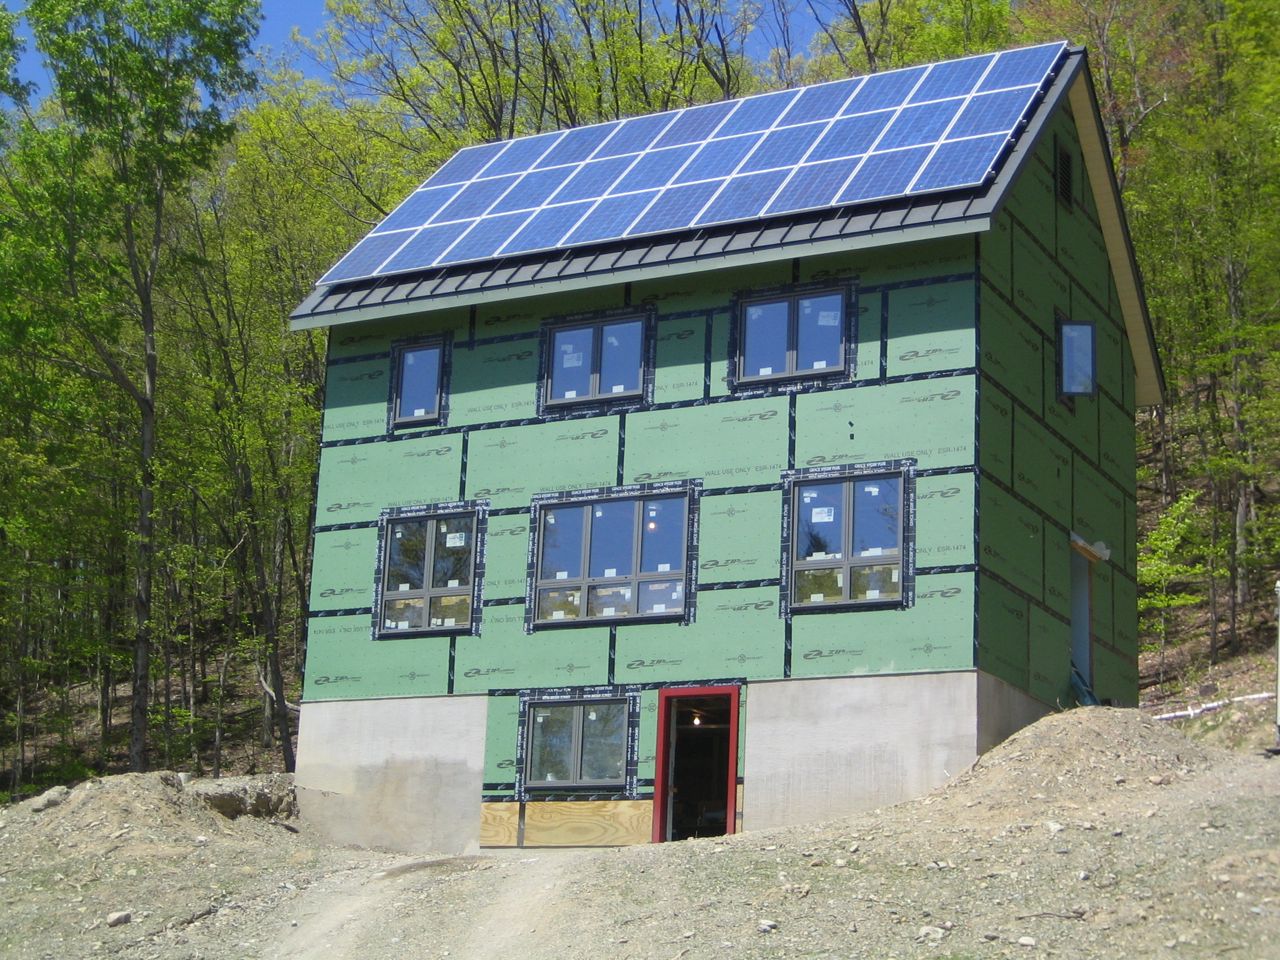
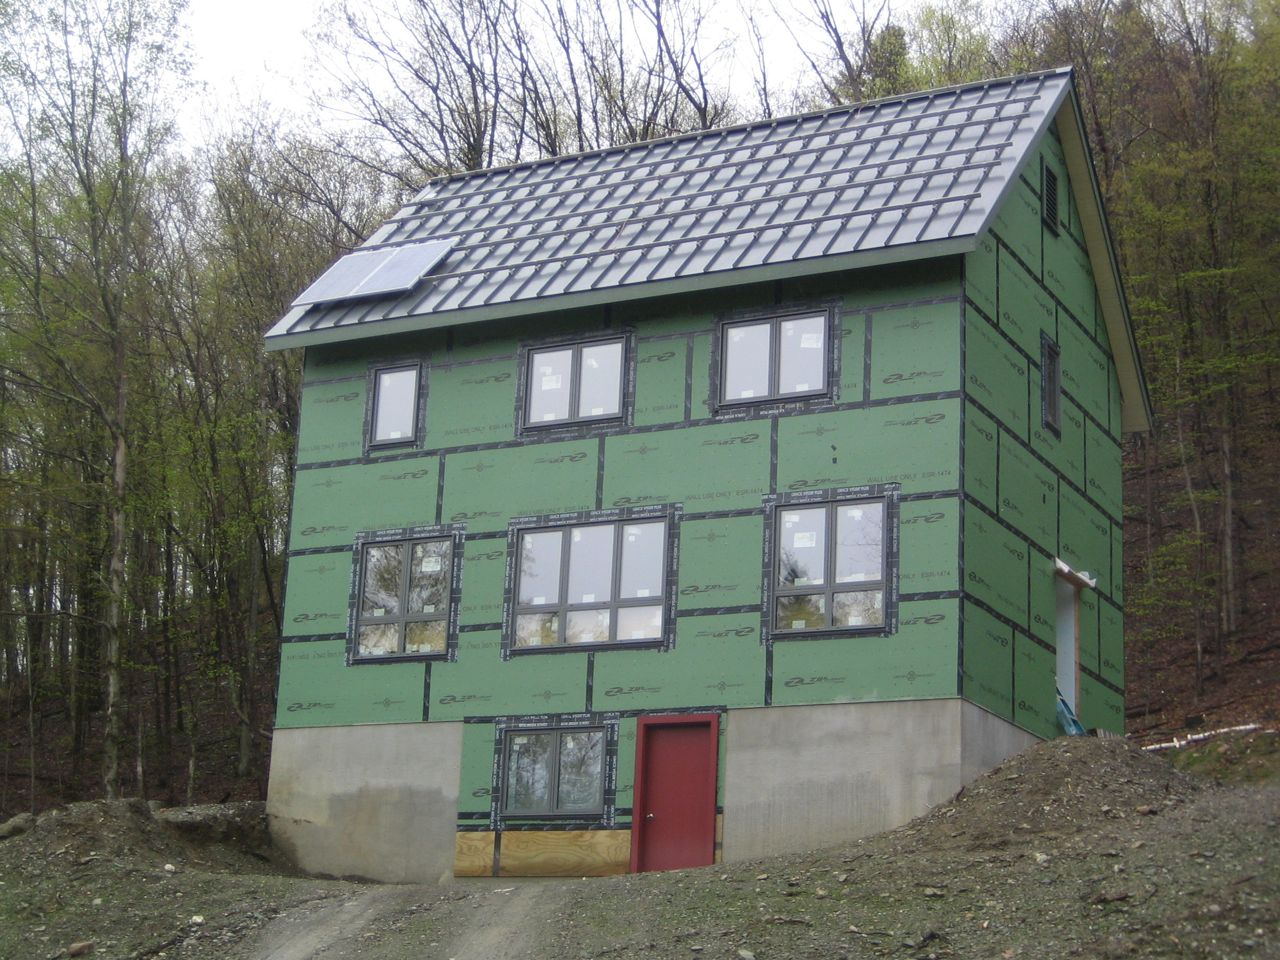
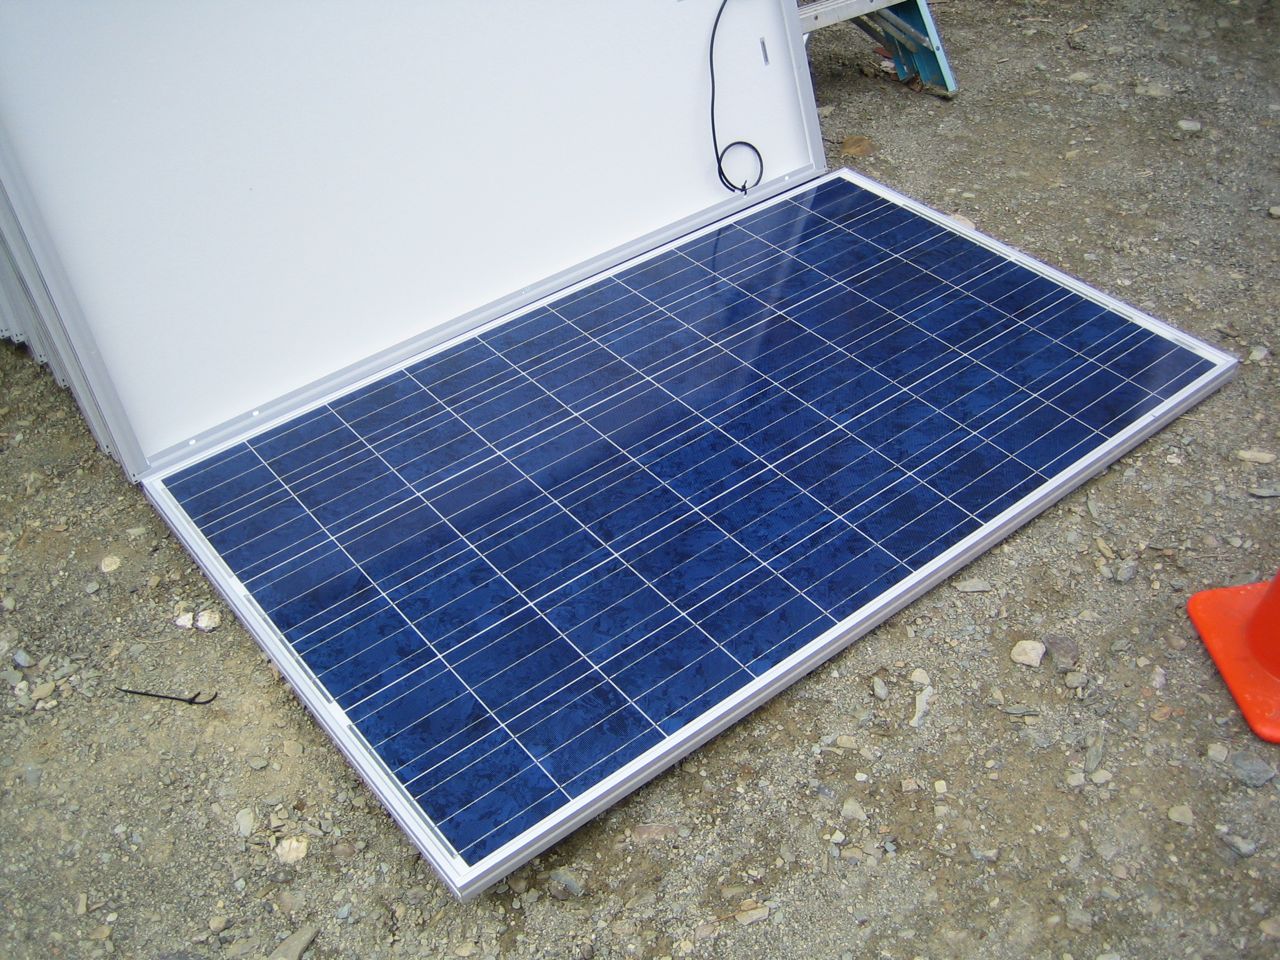
To get to net zero energy use, we must produce enough energy to offset our energy usage over a year. We originally planned to live in the house a few years before installing photovoltaic (PV) panels on the roof, but after we ran the numbers we decided it made sense to do it now rather than wait.