
February performance and fun with charts
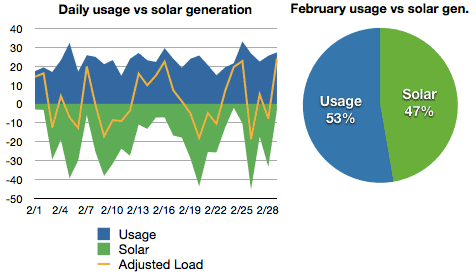
February was generally warmer and sunnier than January (14% less heating degree days, 38% more sun), not to mention 2 days shorter. This partially resulted in 24% lower energy usage in February. (I say, ‘partially resulted’ because we don’t have heating energy values separated out from the total load yet.) If you look at it from a daily usage perspective we’re down 18% from January. That almost got us close to netting out to zero for February.
| All values in kWh (except HDD) | Jan 2012 1 | Feb 2012 2 | Mar 2012 |
|---|---|---|---|
| Solar PV generation | 369 | 597 | -- |
| Usage | 873 | 666 | -- |
| Net usage or (generation) | 504 | 69 | -- |
| Average daily usage | 28 | 23 | -- |
| HDD (base temp 68F) 3 | 1,212 4 | 1,045 5 | -- |
I put together a few charts to compare a cloudy day where the temperatures are dropping throughout the day (February 2nd), and a relatively sunny day where the temperature is rising (February 3rd). There’s always a spike in the morning, the heat, hot water, water pump, and coffee maker all generally go on around the same time. But you can see in this first chart that the HDD day values are low in the morning, meaning it was fairly warm outside in the upper 30’s. No need for the heat pump to kick in. There’s little green on this chart meaning we were not generating a lot of solar power on this day. It also means the house inside temperatures were not getting much help from the sun. Notice how the HDD is getting bigger as the day progresses. It’s getting colder out, down in the mid 20’s. There is clearly more energy being used in the evening as a result.

Compare with the next day below. It continues to get colder until about 8am when it reaches 18F outside. Notice that the heat pump has popped on a few times in the early morning before the morning rush. Then the sun takes over and the temps start to rise, meaning the HDD values get smaller. Very little energy used after the sun kicks in. Evening power spikes a few times for cooking and cleaning.
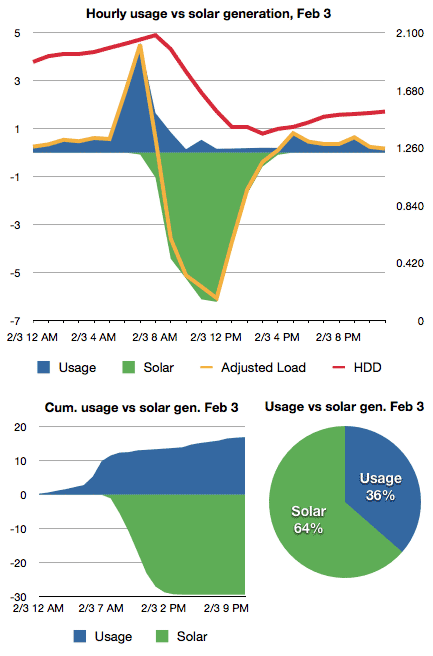
There’s no big surprises here, but it is fun to see the correlation in data.
We also generated our 6th megawatt in February. It took roughly 61 days to generate this megawatt.
| Megawatt Hour | Date | Days |
|---|---|---|
| 0 | Jun 2 2011 | |
| 1 | Jul 7 2011 | 35 |
| 2 | Aug 8 2011 | 32 |
| 3 | Sep 13 2011 | 36 |
| 4 | Nov 1 2011 | 49 |
| 5 | Dec 29 2011 | 58 |
| 6 | Feb 28 2012 | 61 |
If you have any questions (or spot any errors), let me know in the comments.

Categories
- Air sealing 13
- Appliances & Fixtures 4
- Art 3
- Award 4
- Bathroom 8
- Batteries 1
- Decor 5
- Design 10
- Electrical 5
- Energy Calculations 13
- Energy Monitors 4
- Farm 1
- Finance 1
- Flooring 3
- Foundation 9
- Framing 8
- Heating 9
- House 7
- Insulation 8
- Kitchen 6
- Landscaping 3
- Lessons Learned 1
- Performance 60
- Plumbing 10
- Porch 5
- Radon 1
- Rainwater catchment 3
- Research / study 1
- Roof 7
- Septic / Waste water 2
- Sheetrock 6
- Siding 9
- Site Work 22
- Smart home 1
- Solar 64
- Solar Obsessed 10
- Stairs 2
- Surveying 3
- Ventilation 8
- Weather 1
- Windows & Doors 14
- plug-in 3
Archive
- Jan 2021 1
- Dec 2020 2
- May 2020 1
- Jan 2020 1
- May 2019 1
- Jan 2019 3
- Sep 2018 2
- Aug 2018 2
- Jan 2018 1
- Oct 2017 2
- Apr 2017 1
- Jan 2017 1
- Oct 2016 2
- Aug 2016 1
- Apr 2016 2
- Jan 2016 2
- Nov 2015 2
- Oct 2015 1
- Jul 2015 1
- May 2015 1
- Apr 2015 1
- Jan 2015 1
- Dec 2014 1
- Nov 2014 2
- Oct 2014 4
- Sep 2014 2
- Aug 2014 1
- Jul 2014 1
- Mar 2014 3
- Feb 2014 2
- Jan 2014 2
- Nov 2013 1
- Oct 2013 1
- Sep 2013 1
- Jul 2013 3
- Apr 2013 3
- Jan 2013 3
- Dec 2012 2
- Nov 2012 3
- Oct 2012 1
- Sep 2012 3
- Aug 2012 3
- Jul 2012 2
- Jun 2012 1
- May 2012 3
- Apr 2012 2
- Mar 2012 4
- Feb 2012 4
- Jan 2012 5
- Dec 2011 4
- Nov 2011 9
- Oct 2011 10
- Sep 2011 9
- Aug 2011 6
- Jul 2011 6
- Jun 2011 12
- May 2011 8
- Apr 2011 4
- Mar 2011 5
- Jan 2011 6
- Dec 2010 9
- Nov 2010 3
- Oct 2010 4
- Sep 2010 6
- Aug 2010 8
- Jul 2010 6
- Jun 2010 3
- May 2010 3
- Apr 2010 1
- Mar 2010 3
- Feb 2010 3
- Dec 2009 1
- Jun 2009 1
- May 2009 1
- Feb 2009 1
- Dec 2008 1
- Nov 2008 1
- Jun 2008 1