Category: Plumbing
-
October performance
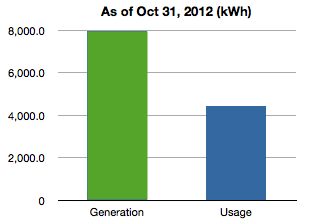
Total usage vs production in kWh as of Oct 31 October was overshadowed by the events of the last week. Despite the best efforts of Hurricane Sandy we are safe and dry at Up Hill House. We had plenty of strong wind gusts, but not nearly as bad as the costal regions. We were prepared for the worst. We stocked up on water and easy to prepare meals. We have a small propane burner that can be used to heat water or simple cooking. We packed the chest freezer with ice. We filled the bathtub for flushing and the cistern was full for the farm critters. Thankfully the power never went out.
Read more... -
September performance
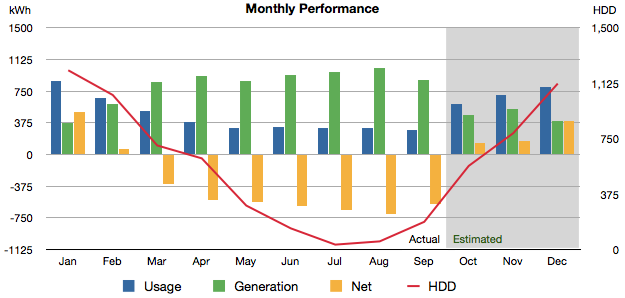
performance chart september Fall weather arrived last month. More rain and clouds with cooler nights. We generated 883 kWh in September, down 15% from last month, but still about 37 kWh better than predicted. We generated on average 29.4 kWh per day.
We used 292 kWh, our lowest month yet. That’s down 7% from the previous month. We used the air conditioning only 2 days and heating for 1 day. We used 9.5 kWh for cooling / dehumidification, and 5.9 kWh for heating. Together that’s 5% of our month’s total usage. We generated a 591 kWh surplus this month, our 7th surplus month in a row.
I changed the format of the table a bit. Months now run down the table instead of across.
Read more... -
August performance
We generated 1,018 kWh in August, up 5% from last month. That is our best month yet, and our best daily average of 32.8 kWh per day as compared to the last two month’s average of 31.3 kWh per day. Typically solar generation starts to decline in August, with decreasing sunlight hours, more clouds and more heat, but not this year.
Read more... -
Our water usage
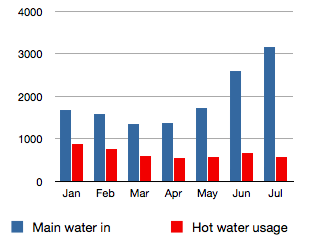
Water usage to date In our July performance post I stated that we were tracking our water usage and water pump usage to calculate the efficiency of the pump. Dan Gibson asked in a comment about our water usage, so I thought I’d cover that here. He says in his comment that there are not a lot of actual hard numbers on water usage and he’s definitely right. Most estimates I’ve seen online say 50 to 100 gallons per person, which seems both excessive and vague at the same time.
We installed water meters on the main line and the inlet to the hot water tank. We have usage data starting in January when we moved in.
Read more... -
July performance
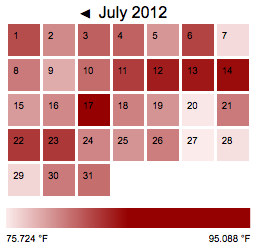
Heat map of high temps in July We generated 970 kWh in July, up 3% from last month. That is our best month yet, but in line with last month’s daily average of 31.3 kWh. We used 319 kWh, 5% less per day on average than last month. We turned on the air conditioning for 3 days during a particularly humid run, and periodically for a few days the next week. We used 12 kWh for cooling / dehumidification, 8% of our month’s total usage. We generated a 651 kWh surplus this month, our 5th surplus month in a row and highest yet.
Read more... -
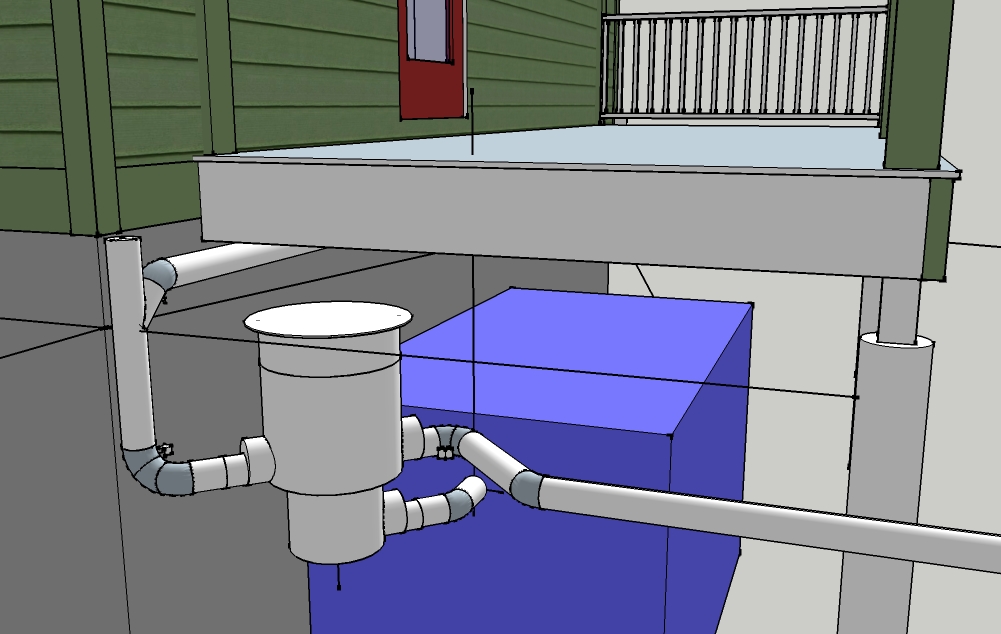
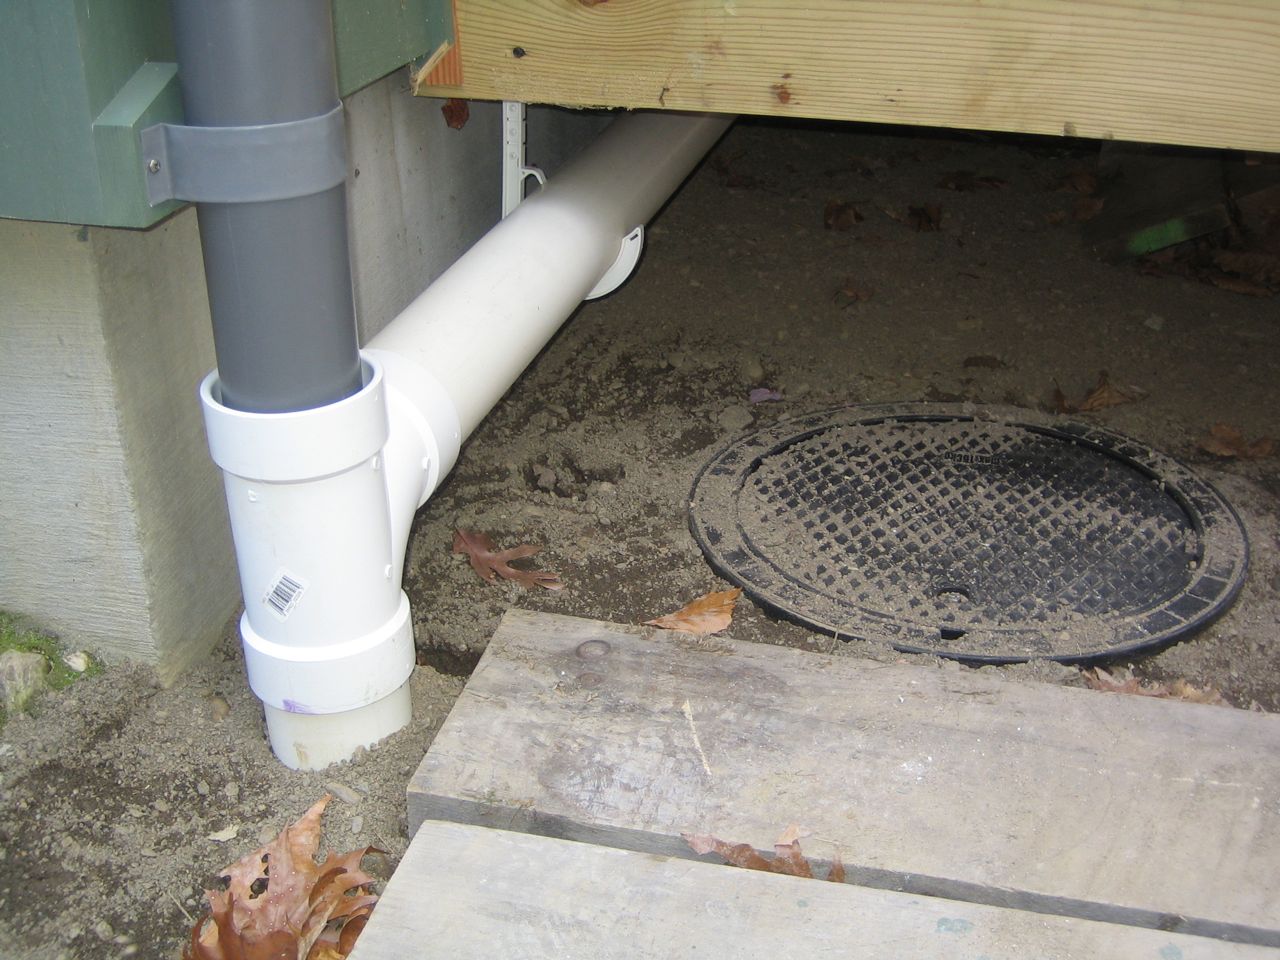
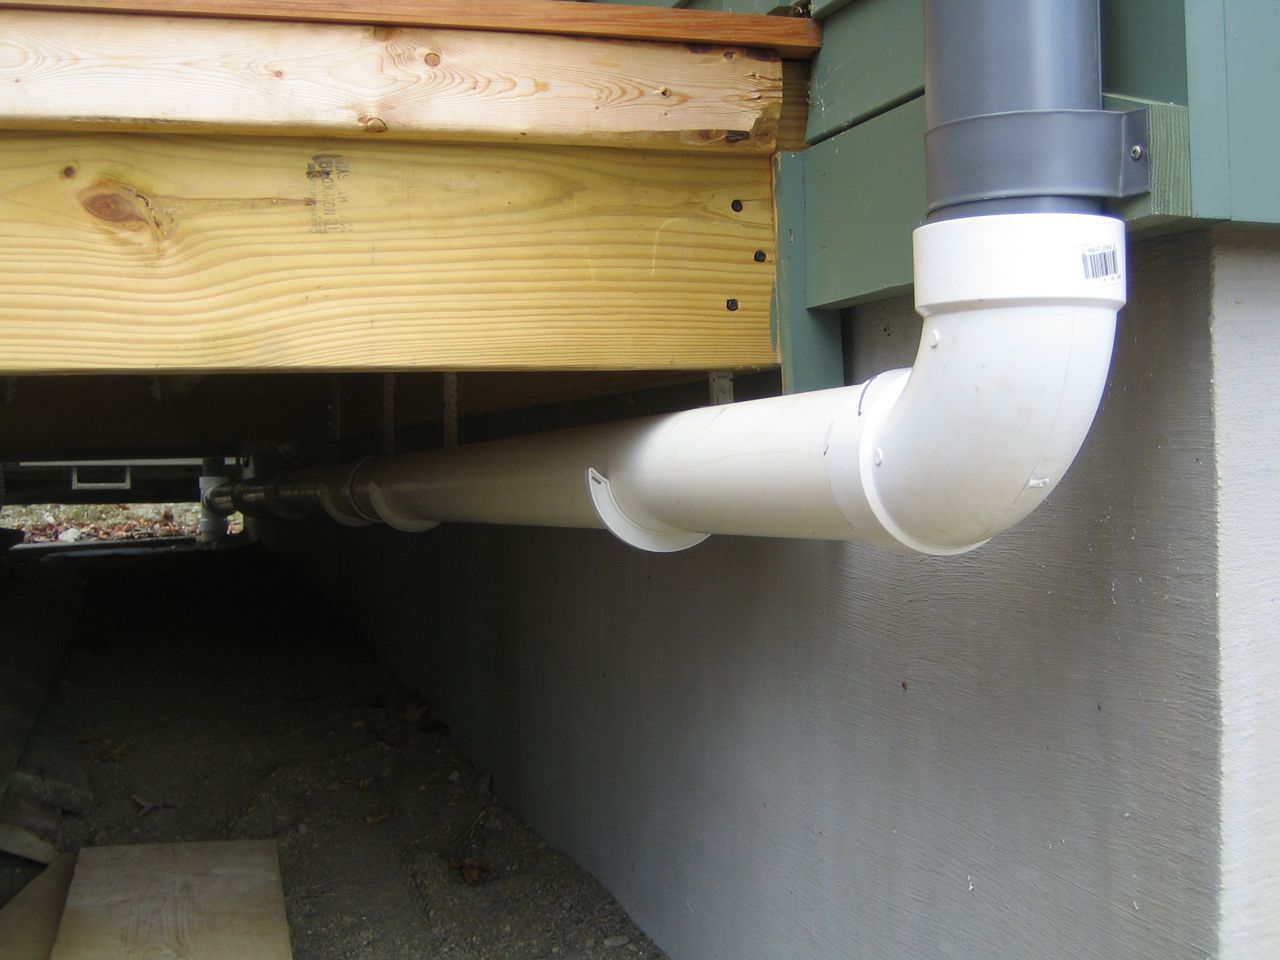
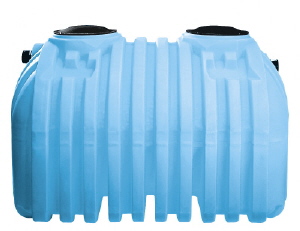
Rainwater catchment system completed
Read more... -
Plumbing stuff and water usage
Read more...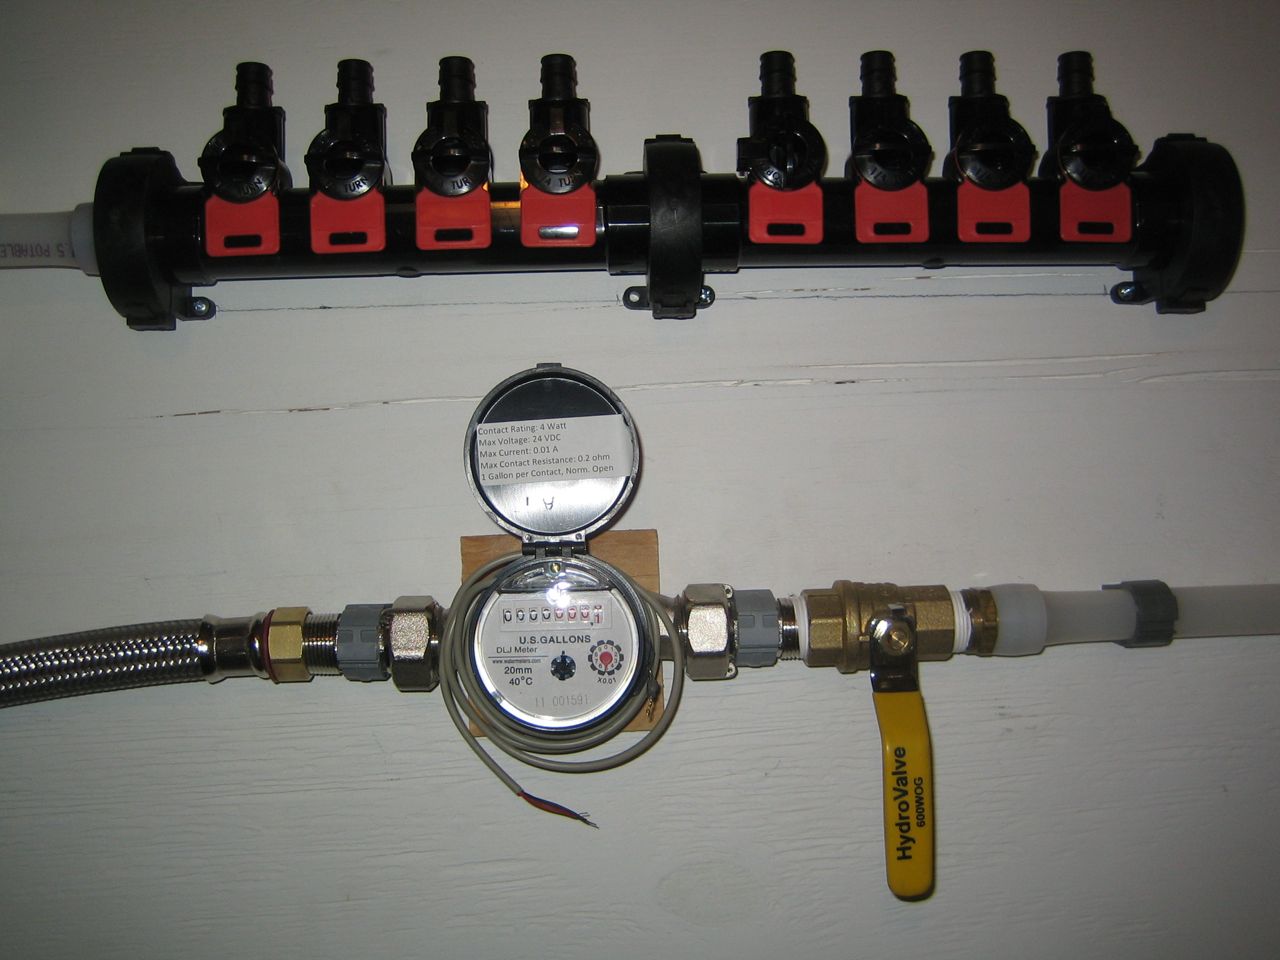
Meter at hot water tank intake 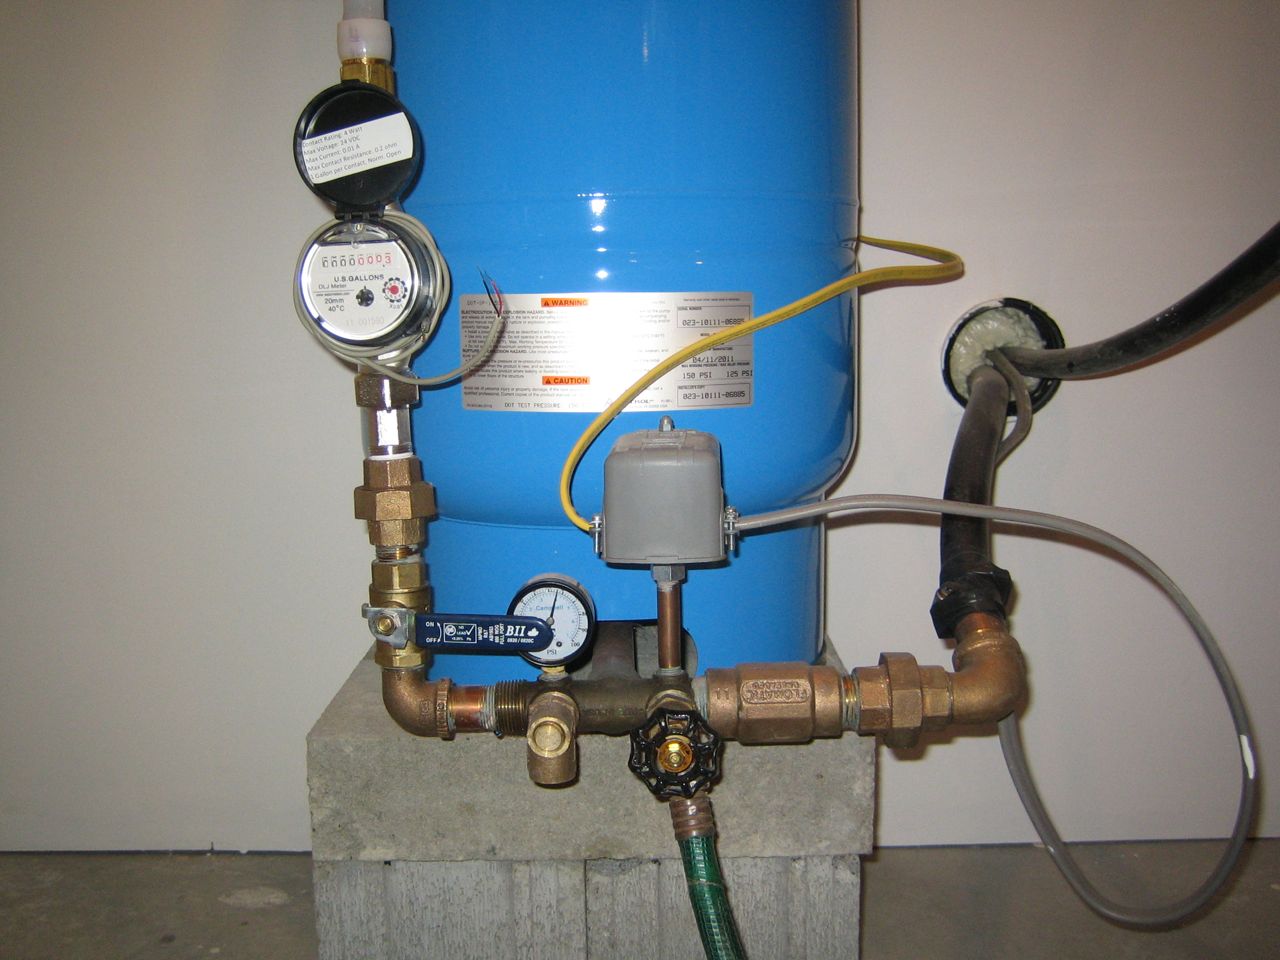
Total water usage meter at pressure tank 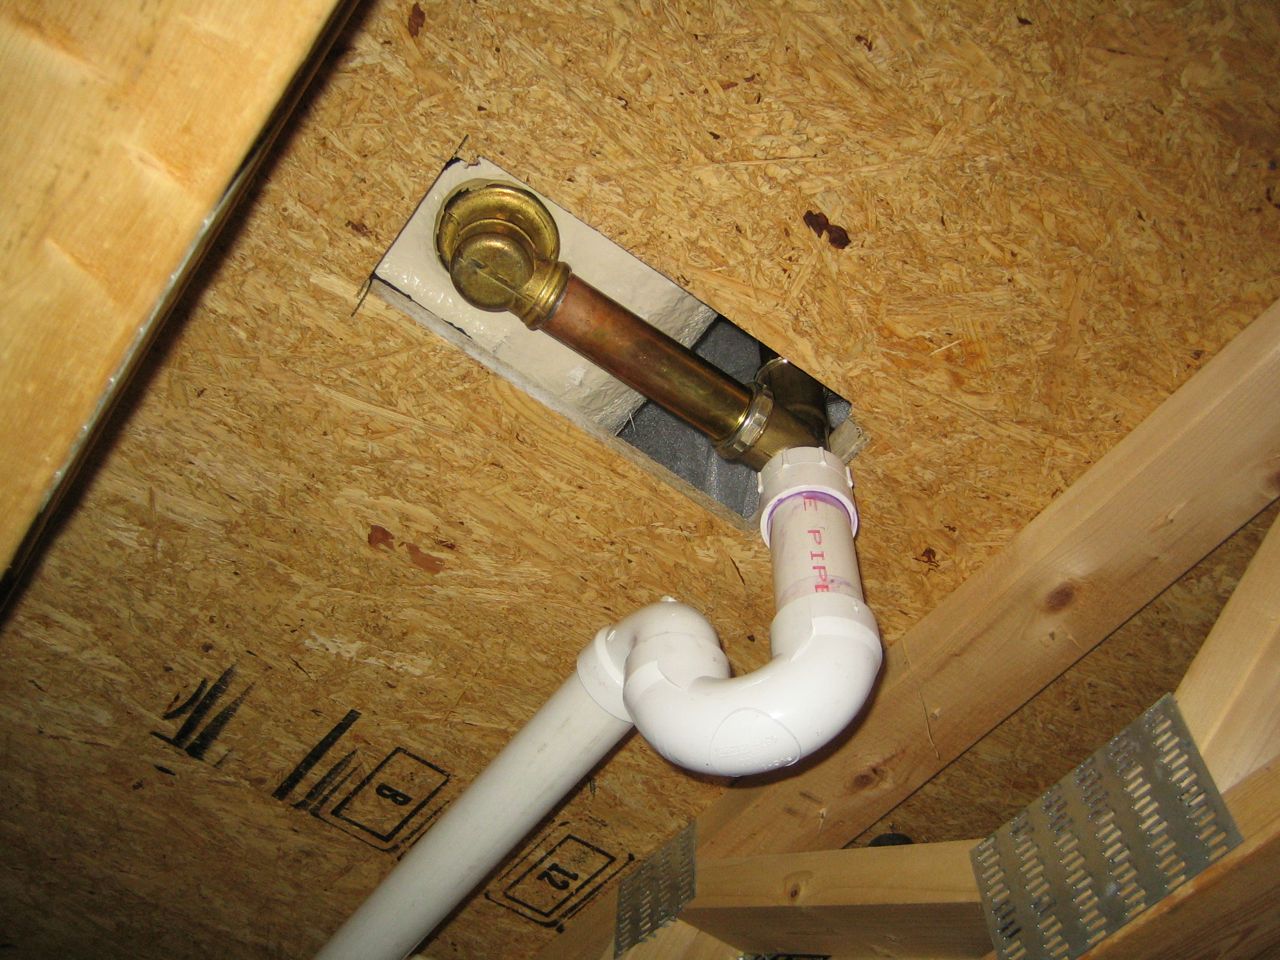
Bathtub drain and trap 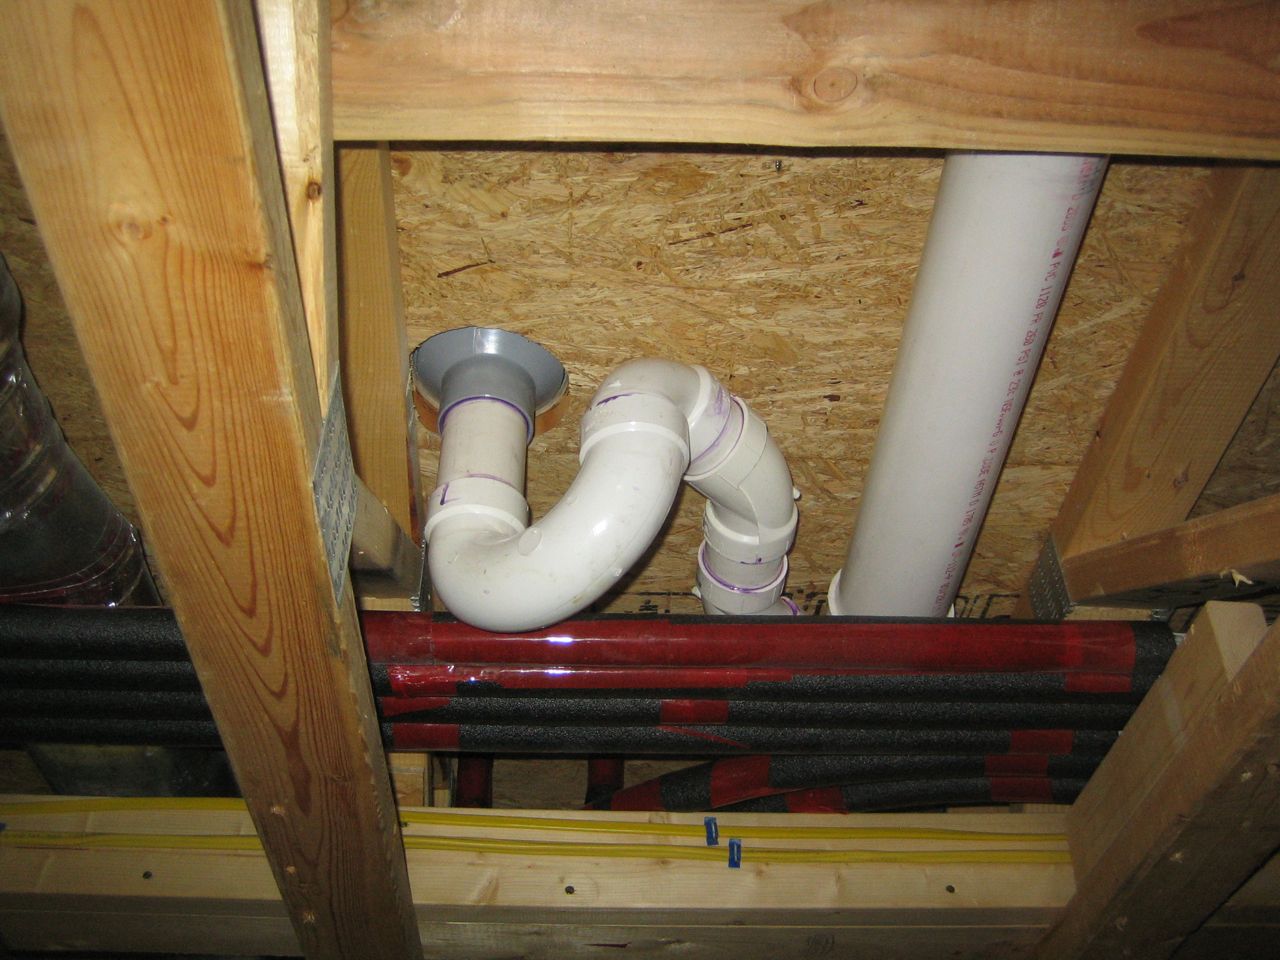
Shower trap 
Tub installed 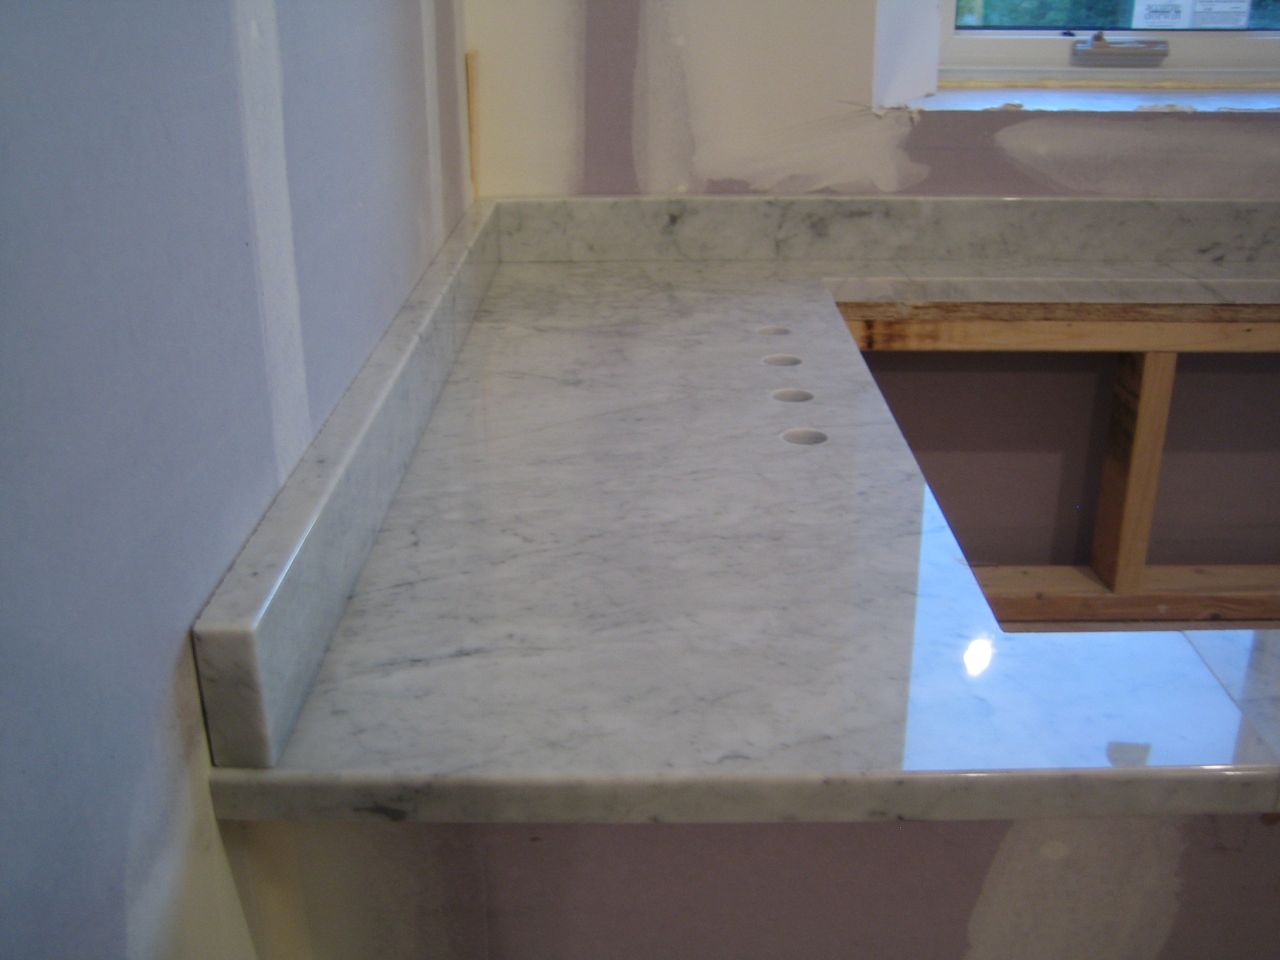
Marble surround -
September Updates
Read more... -
July updates
Read more...
Second coat of stain 
Porch dawg 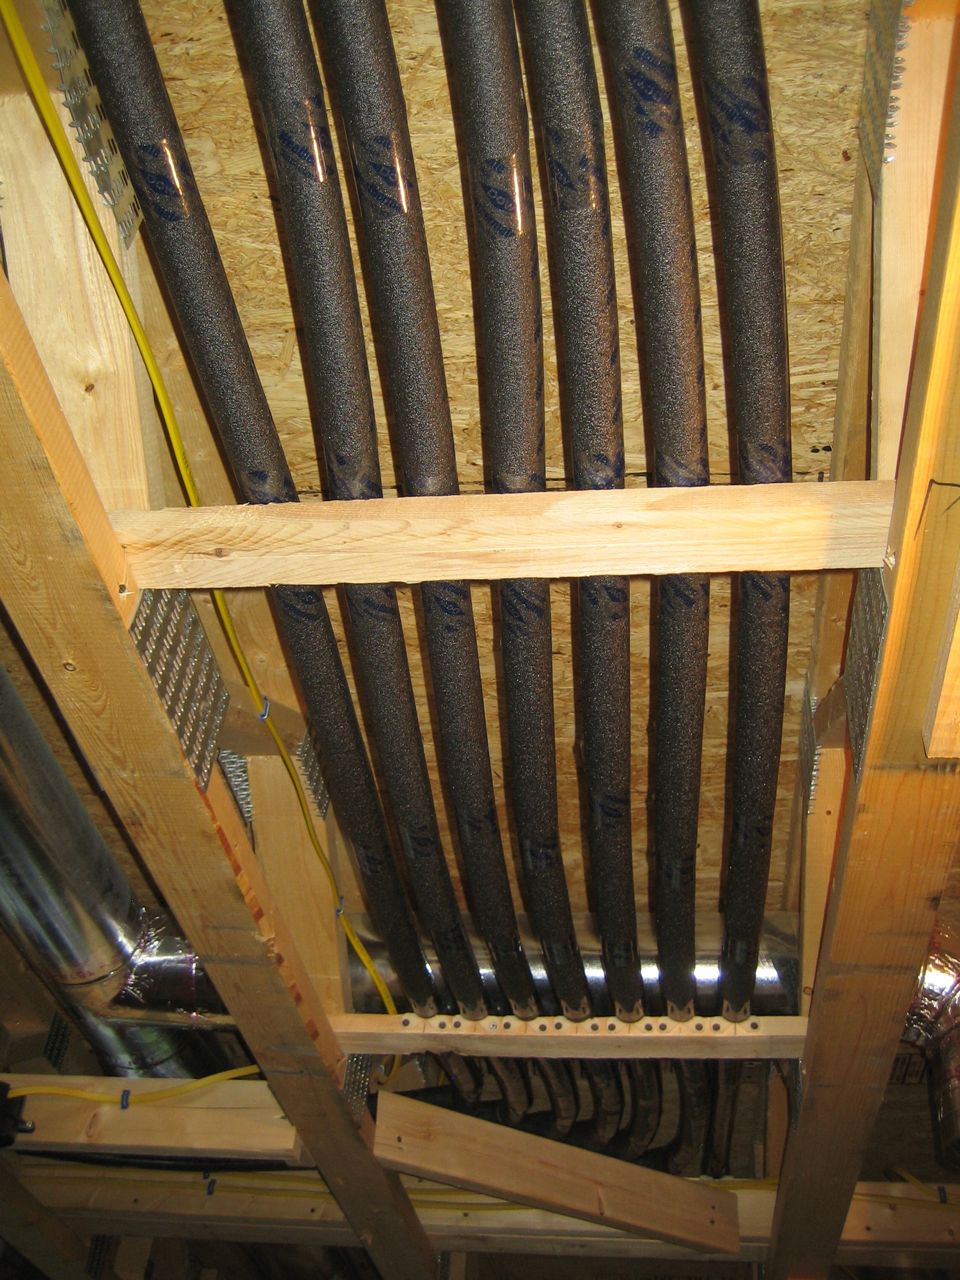
Remember all those colorful pipes? 
Dbl. stud wall at stair for ASHP tubing 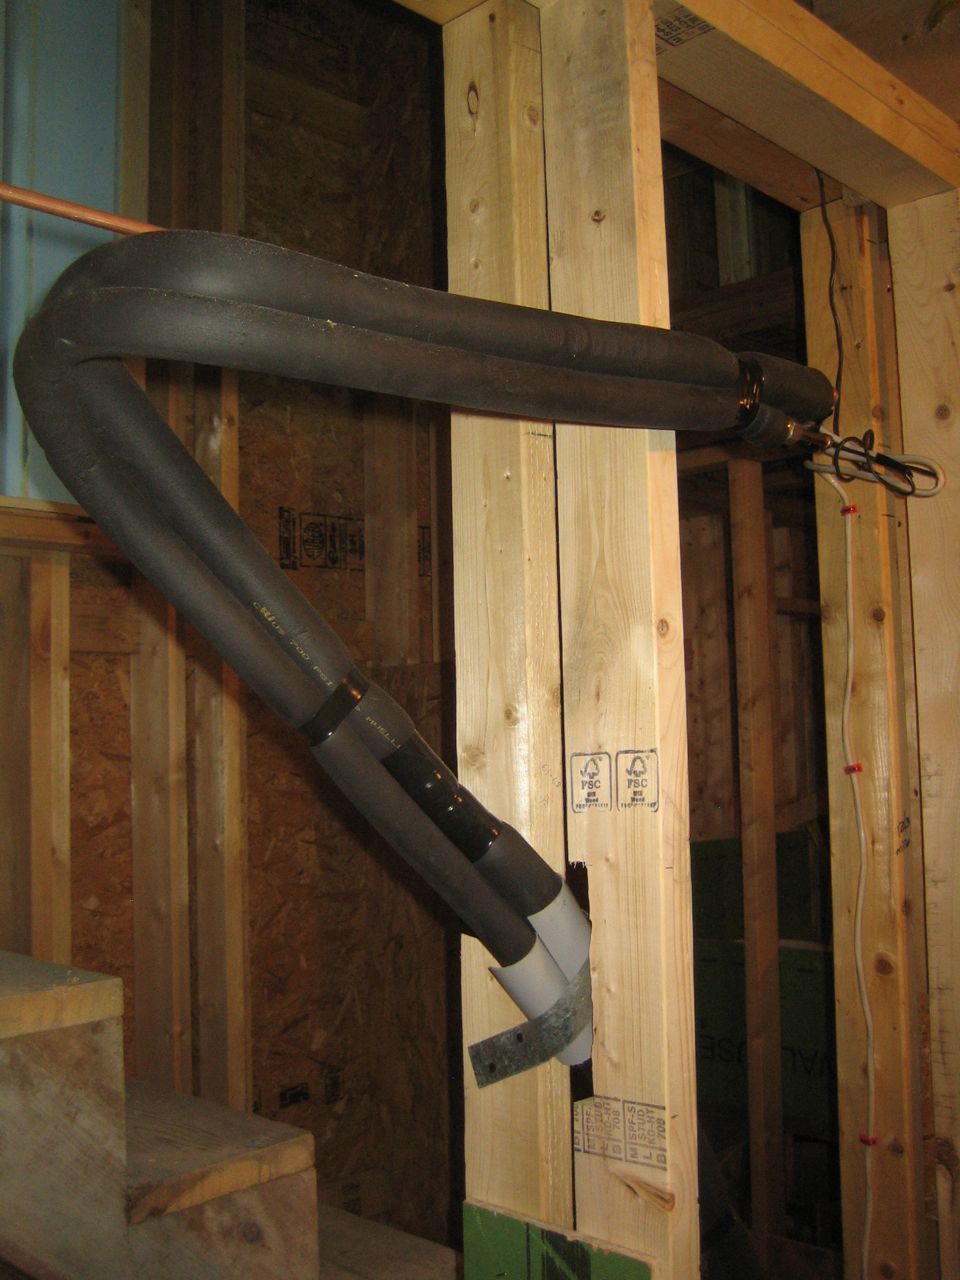
Insulated refrigerant tubing 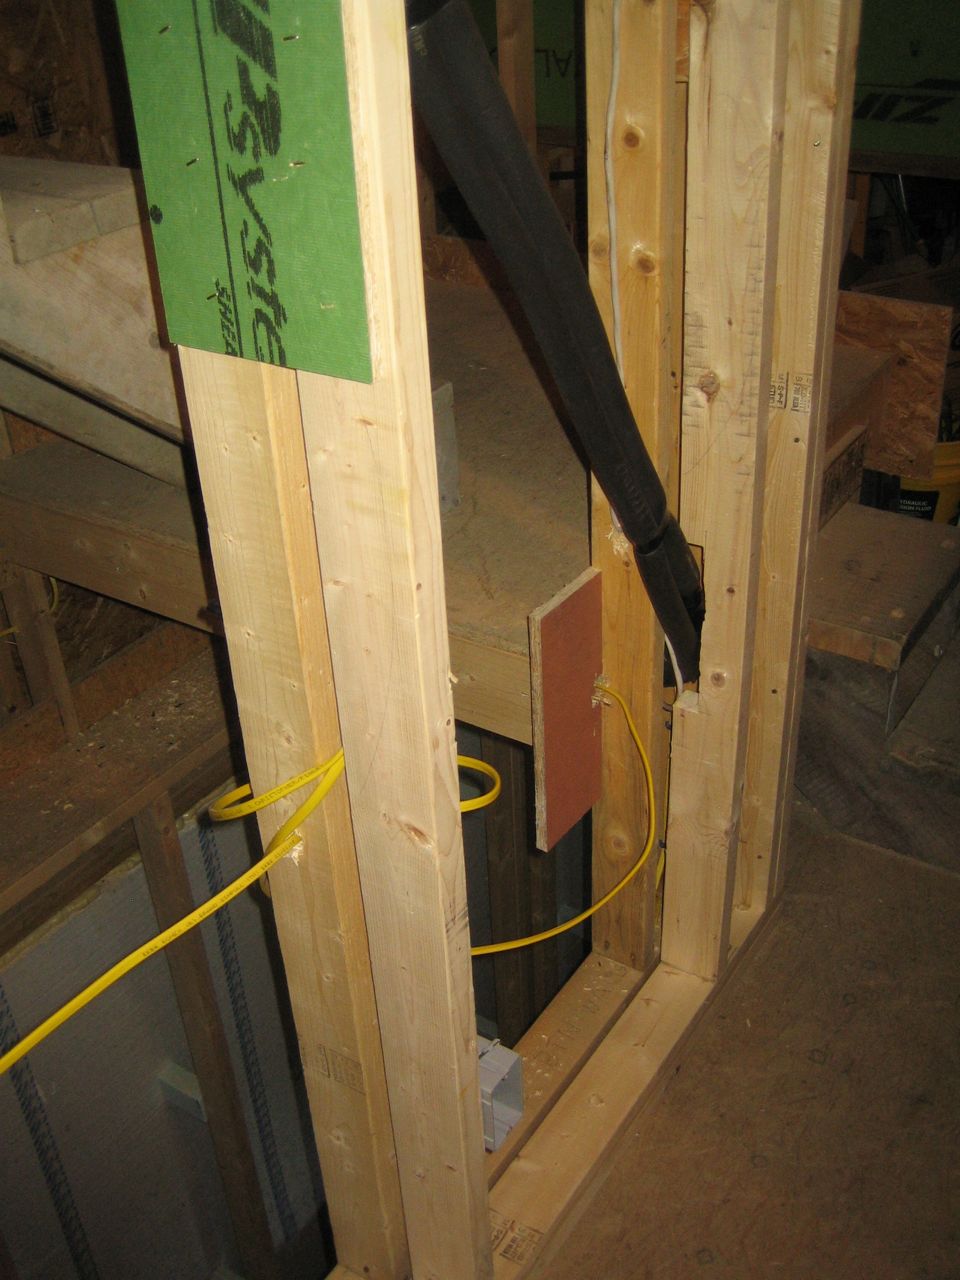
Tubing goes down and through landing to outside wall 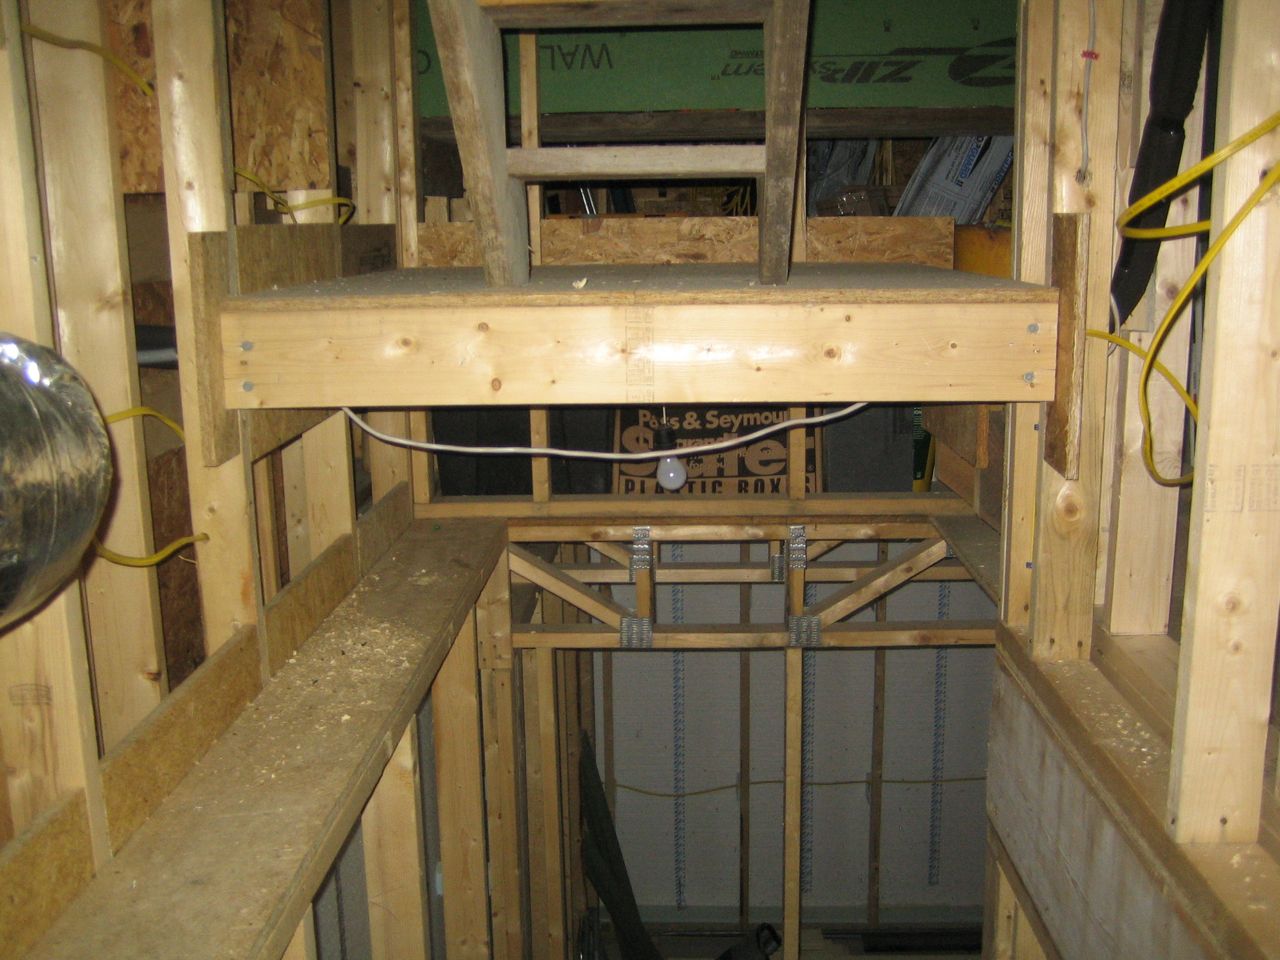
View of landing from basement stair. Tubing enters landing on right and exits on the left. 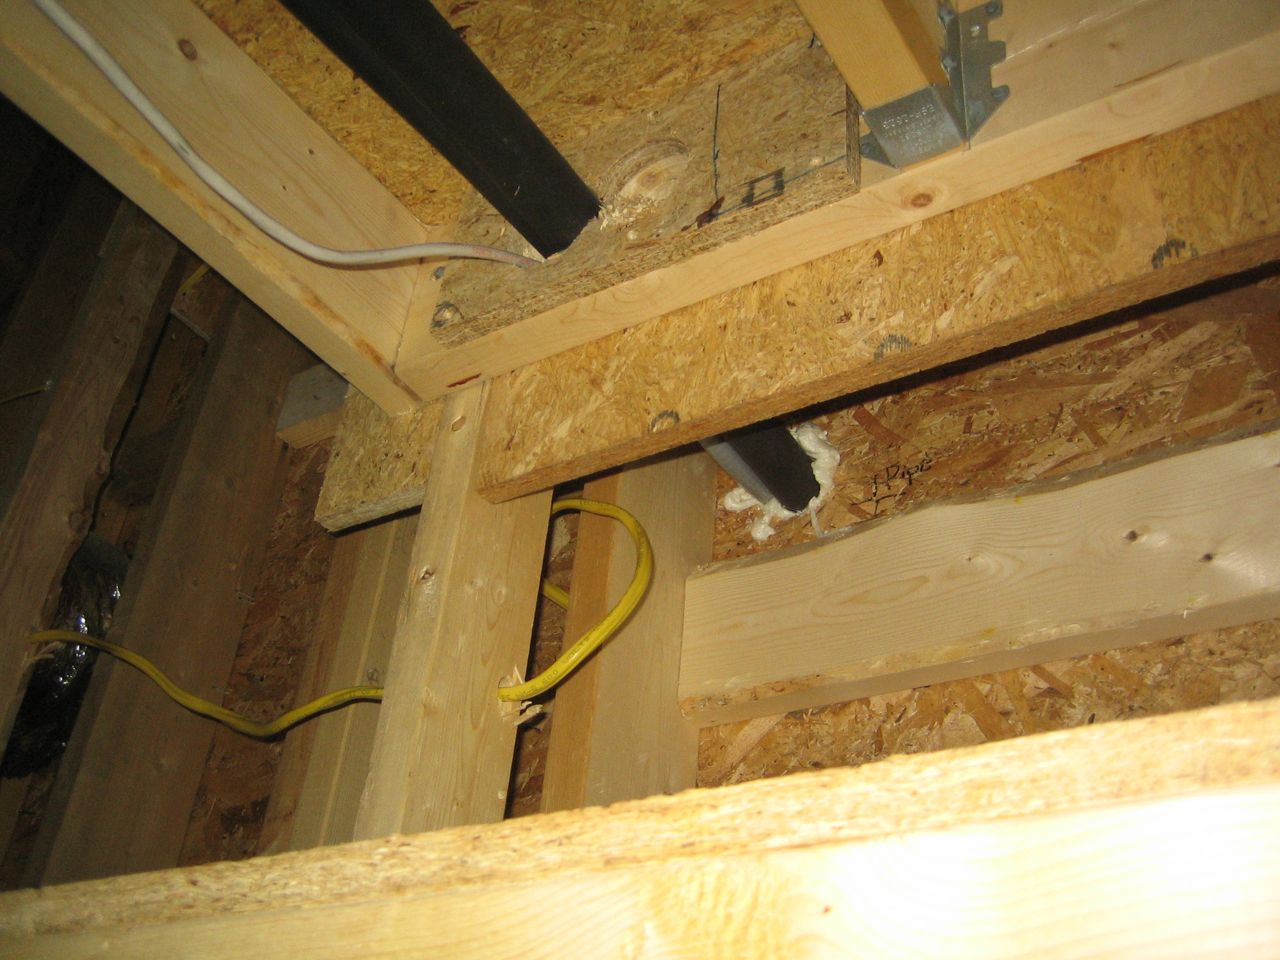
Tubing at exterior wall with 1 part foam seal 
Condensate drain at washer/dryer drain -
Bath Time
Last week the plumber roughed in the waste pipes and venting. Soon he’ll begin the hot and cold water supply lines. He asked what faucets we’re using to make sure he has all the right connections, specs, etc. This prompted a mini bath shopping spree, and an opportunity for me to share our bath plans.
Read more...
Categories
- Air sealing 13
- Appliances & Fixtures 4
- Art 3
- Award 4
- Bathroom 8
- Batteries 1
- Decor 5
- Design 10
- Electrical 5
- Energy Calculations 13
- Energy Monitors 4
- Farm 1
- Finance 1
- Flooring 3
- Foundation 9
- Framing 8
- Heating 9
- House 7
- Insulation 8
- Kitchen 6
- Landscaping 3
- Lessons Learned 1
- Performance 60
- Plumbing 10
- Porch 5
- Radon 1
- Rainwater catchment 3
- Research / study 1
- Roof 7
- Septic / Waste water 2
- Sheetrock 6
- Siding 9
- Site Work 22
- Smart home 1
- Solar 64
- Solar Obsessed 10
- Stairs 2
- Surveying 3
- Ventilation 8
- Weather 1
- Windows & Doors 14
- plug-in 3
Archive
- Jan 2021 1
- Dec 2020 2
- May 2020 1
- Jan 2020 1
- May 2019 1
- Jan 2019 3
- Sep 2018 2
- Aug 2018 2
- Jan 2018 1
- Oct 2017 2
- Apr 2017 1
- Jan 2017 1
- Oct 2016 2
- Aug 2016 1
- Apr 2016 2
- Jan 2016 2
- Nov 2015 2
- Oct 2015 1
- Jul 2015 1
- May 2015 1
- Apr 2015 1
- Jan 2015 1
- Dec 2014 1
- Nov 2014 2
- Oct 2014 4
- Sep 2014 2
- Aug 2014 1
- Jul 2014 1
- Mar 2014 3
- Feb 2014 2
- Jan 2014 2
- Nov 2013 1
- Oct 2013 1
- Sep 2013 1
- Jul 2013 3
- Apr 2013 3
- Jan 2013 3
- Dec 2012 2
- Nov 2012 3
- Oct 2012 1
- Sep 2012 3
- Aug 2012 3
- Jul 2012 2
- Jun 2012 1
- May 2012 3
- Apr 2012 2
- Mar 2012 4
- Feb 2012 4
- Jan 2012 5
- Dec 2011 4
- Nov 2011 9
- Oct 2011 10
- Sep 2011 9
- Aug 2011 6
- Jul 2011 6
- Jun 2011 12
- May 2011 8
- Apr 2011 4
- Mar 2011 5
- Jan 2011 6
- Dec 2010 9
- Nov 2010 3
- Oct 2010 4
- Sep 2010 6
- Aug 2010 8
- Jul 2010 6
- Jun 2010 3
- May 2010 3
- Apr 2010 1
- Mar 2010 3
- Feb 2010 3
- Dec 2009 1
- Jun 2009 1
- May 2009 1
- Feb 2009 1
- Dec 2008 1
- Nov 2008 1
- Jun 2008 1

