
Our new wireless energy monitor

We were excited to see our new eMonitor 4 from Powerhouse Dynamics arrive Wednesday. We purchased it through EnergyCircle. Sage, the rep at EnergyCircle, said it would ship first thing in the week and he wasn’t kidding. For more info see our previous post, Power monitoring – lessons learned.
The installation was very easy. The setup had a few kinks.
First the install
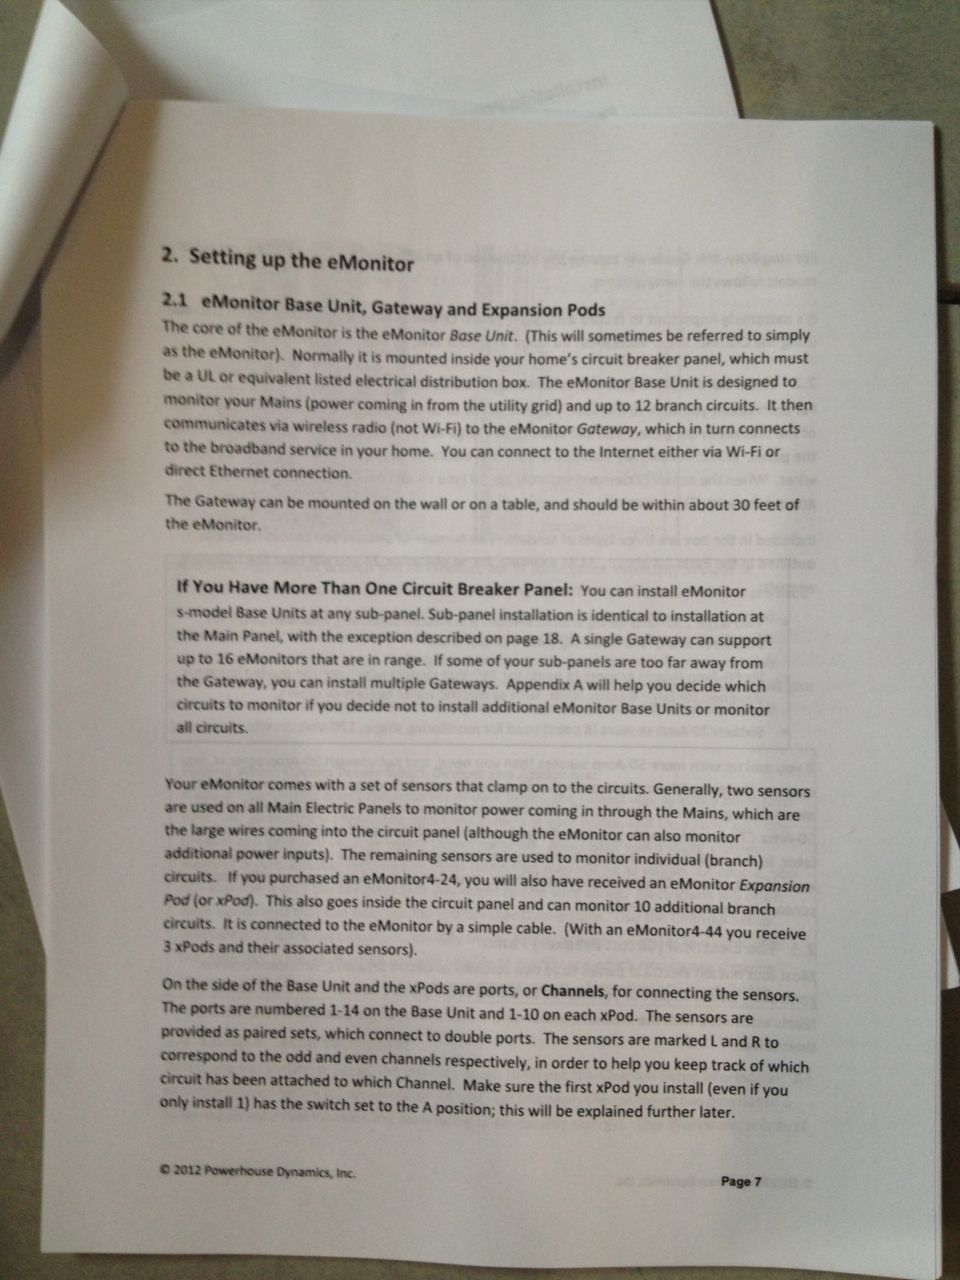
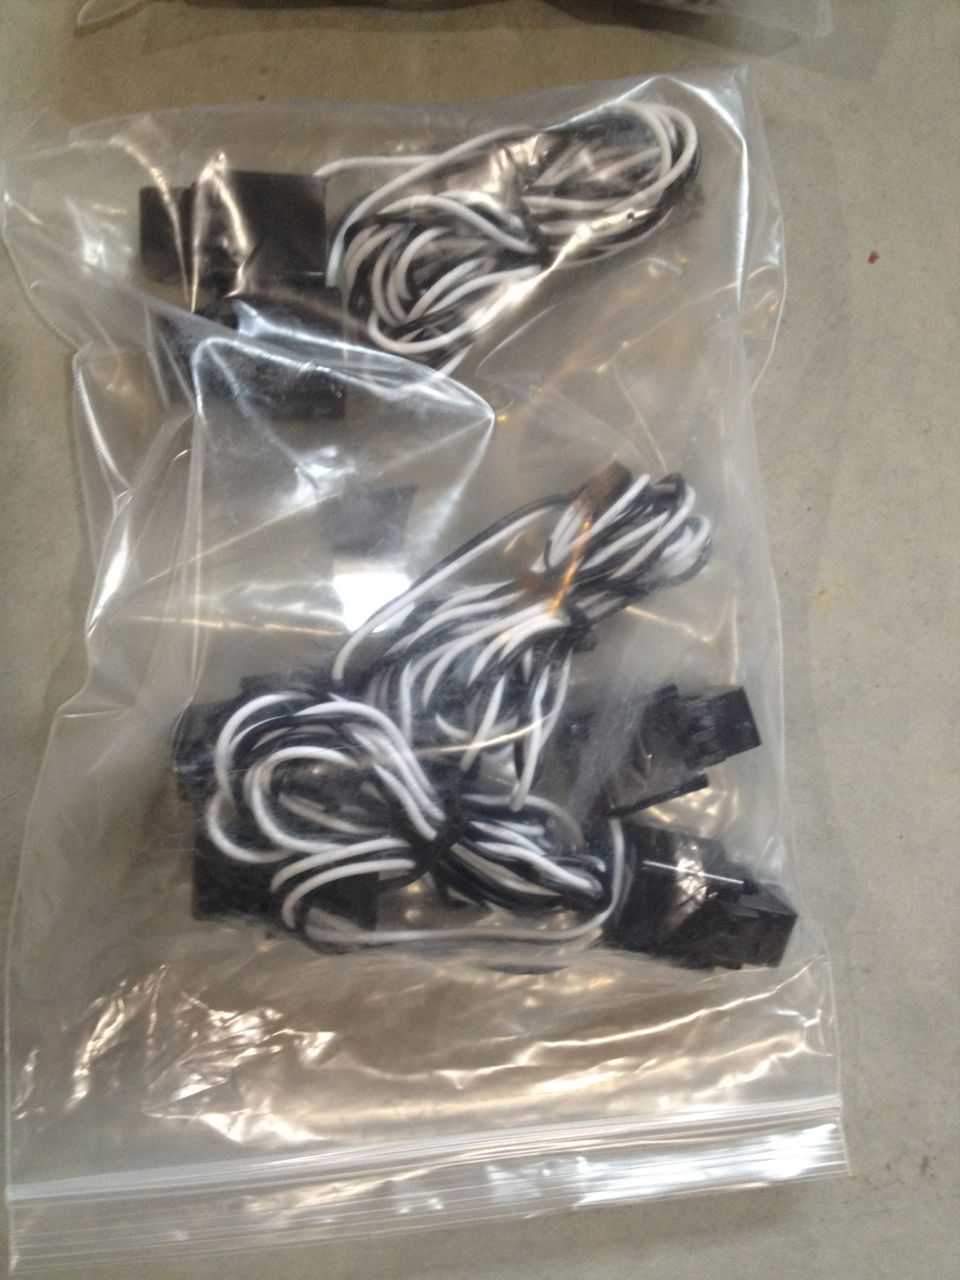
The documentation for the eMonitor is very good at a hefty 41 pages. We bought the 14 circuit model with includes 14 sensors (called Current Transformers or CTs). 14 sounds like a lot, but two of those sensors are for the two mains coming into the panel. If you have 200 amp service, which is fairly standard, you have 2 lines carrying 100 amps each. Now you’re left with 12 sensors.
That still sounds like a lot, but most heavy use appliances use double breakers or 240V. Some of these appliances use power evenly across both circuits which means you only need to monitor one of the circuits. Examples seem to vary, but for us that includes the hot water heater, water pump and clothes dryer. If the appliance can use power _un_evenly across the two circuits or you’re not sure if it uses balanced power, then you need to monitor both circuits for an accurate reading.
And for the final complication, six sensors are for 50 amp circuits and the other six are for 20 amp circuits. Which means, 12 sensors doesn’t get you far. For us, we can only realistically track eight things:
-
Solar generation (1-50A sensor)
-
Hot water heater (1-50A sensor)
-
Air source heat pump (2-20A sensors)
-
Well pump (1-20A sensor)
-
Dryer (1-20A sensor) Probably should have used 2 but then we wouldn’t have been able to track the washer or dishwasher.
-
Washer (1-20A sensor)
-
Dishwasher (1-20A CT)
-
Range (2-50A sensors)
See what we mean? 14 total sensors, 8 things to track. If you count it up, you’ll see we have an extra set of 50 amp sensors left over. We don’t have anything else in the 50 amp range to monitor. So we can’t even make use of everything that comes in the package. Sage tried gently to steer us toward the 24 circuit model, but we felt like we were already spending more than we had budgeted. Would the extra circuits be nice? Yes. Do we really need to track plug loads and lighting circuits? No.
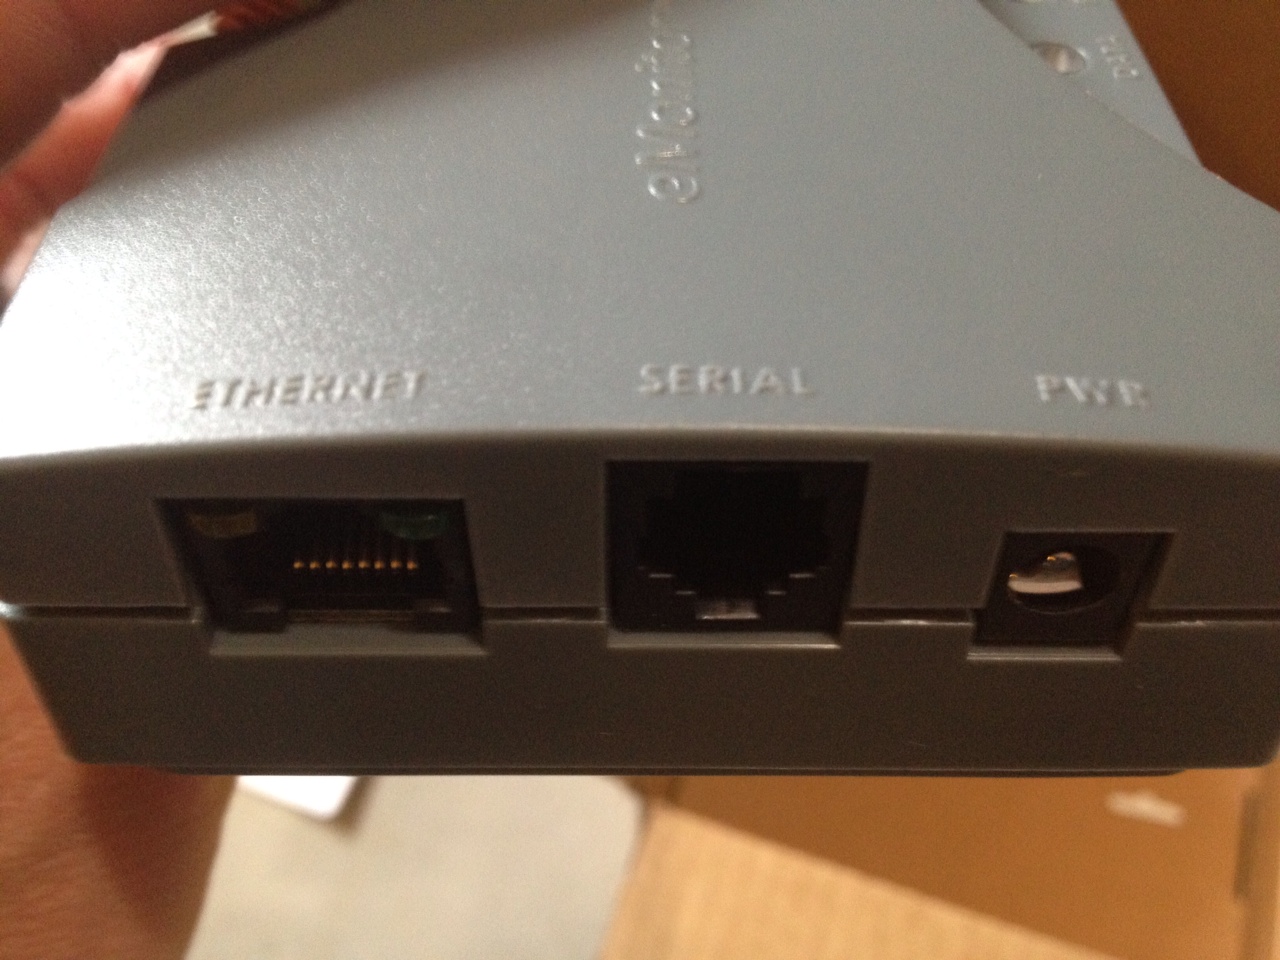
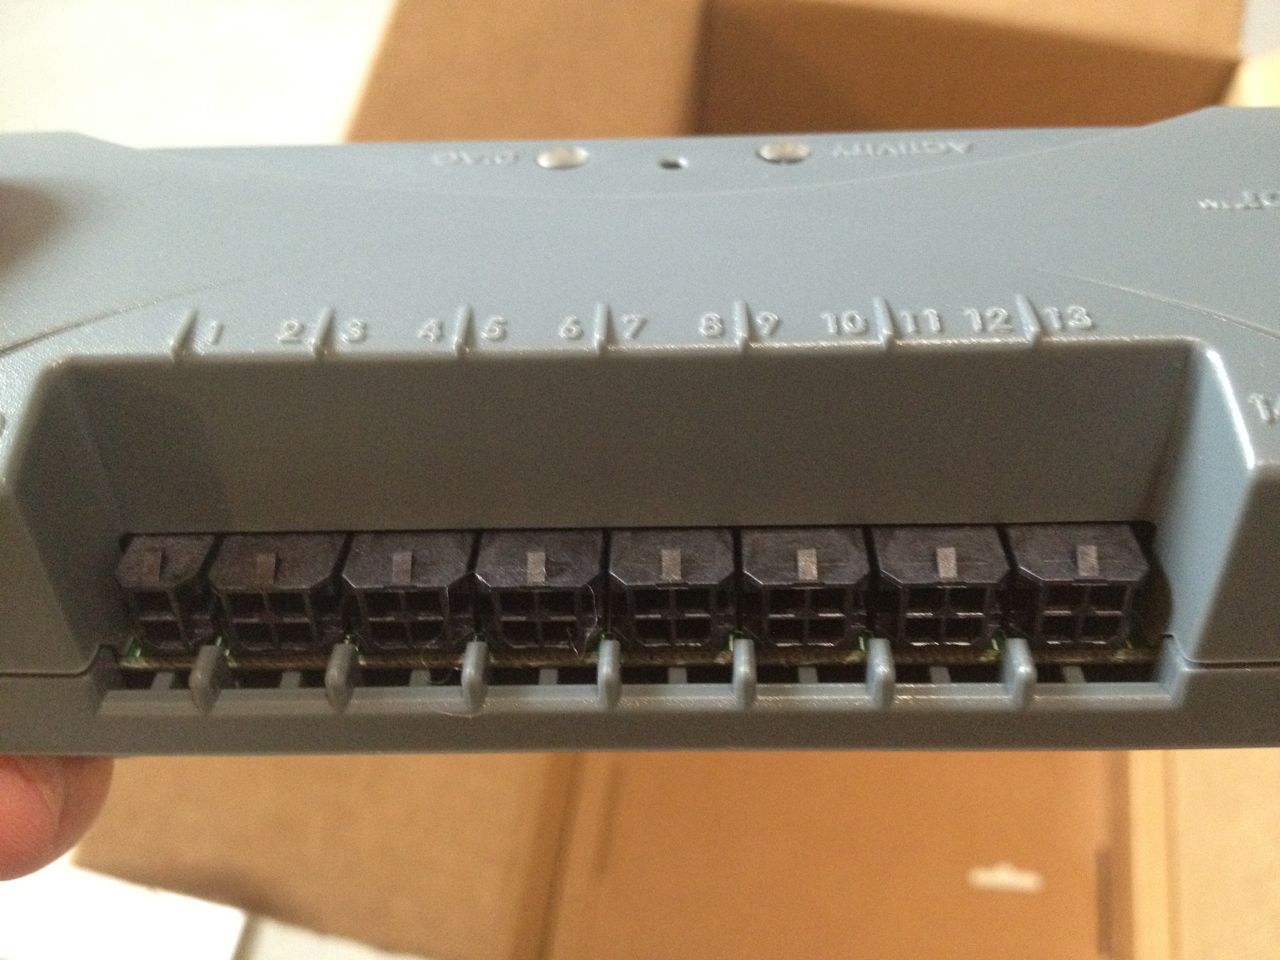
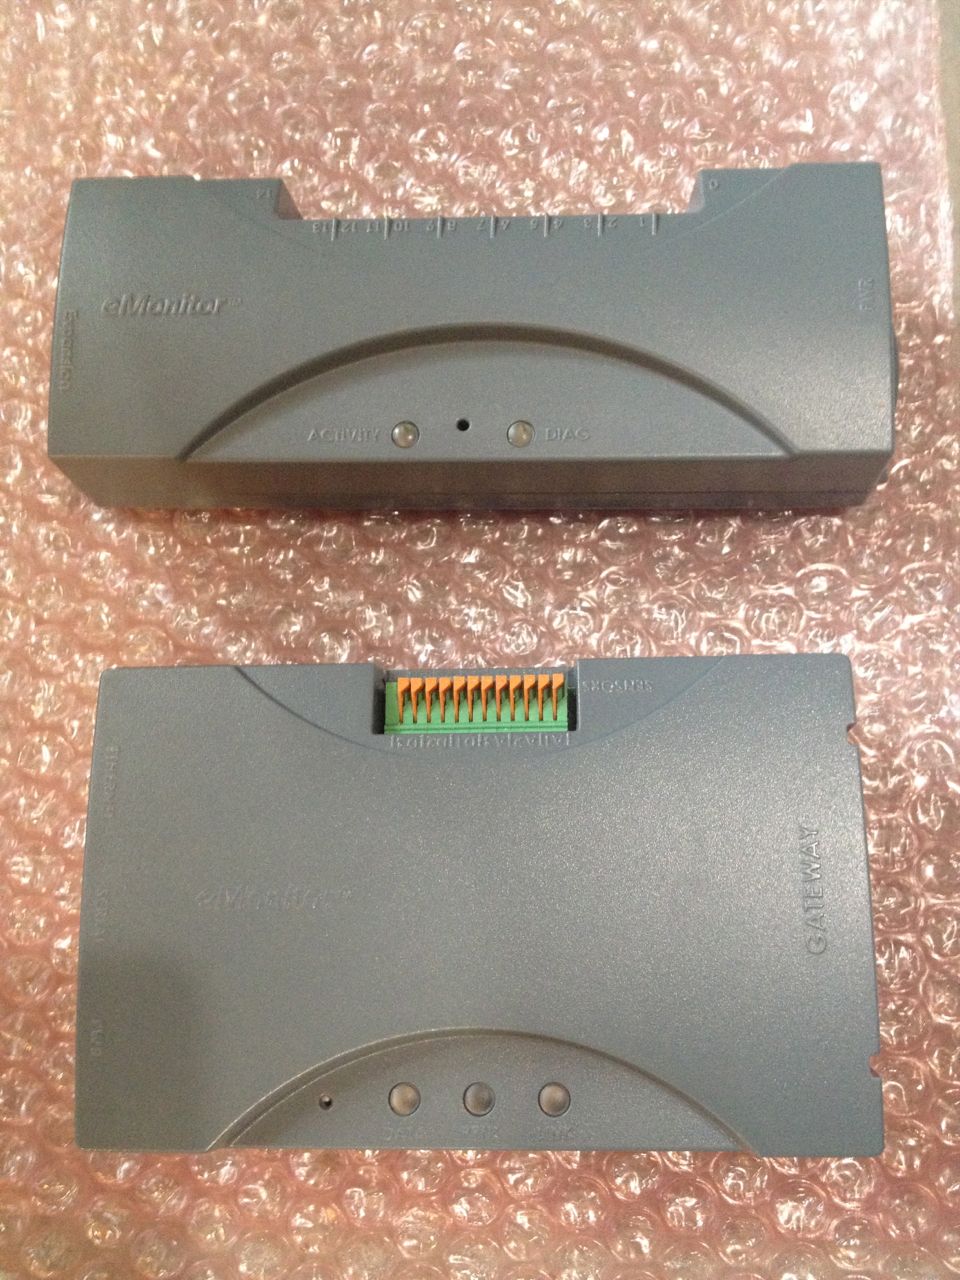
The base unit connects to all the sensors and fits inside your panel box. Ours was a bit of a squeeze. It draws its power from one of the breakers, so you will need a free breaker slot to power the unit. The base unit transmits data to the gateway via radio signals, and from the gateway to the wireless router via WiFi.
This part of the installation was incredibly easy. I was pleasantly surprised. The gateway initially sets itself up as a wifi network, so all we had to do was connect to the gateway’s wifi network, use our browser to pull up the configuration page on the gateway IP address and enter our wireless router connection info.
One thing to note about the install. If you really want to connect the gateway to your router via ethernet and not use the wireless feature, you can. You just need to make sure your dealer knows that so they can pre-setup the gateway to work with an ethernet connection. From the documentation, it appears that you can also change this later with a software download.
The kinks
So far so good, but then the problems started. This is a new product and you have to expect a few kinks. Version 4 now separates the product purchase from the service license purchase, so we had to go to the Powerhouse Dynamics site and purchase a license to operate the product. When I tried to use the online registration process it wouldn’t let me complete the process. To add insult to injury, there was no email or phone number on the site. Thankfully, Sage pointed us directly to the Powerhouse Dynamics CEO Martin and master support guy Ben.
As it turned out, the license purchasing part of their site doesn’t work with Safari. Not a big problem. Last I checked Safari has about 5% of the desktop marketshare, but over 60% of the mobile/tablet market. This is 2012 and there is no good reason not to test and support your consumer product for Mac or iPad users, particularly for a premium product like eMonitor. We simply had to switch to Firefox and the registration process was completed.
Next problem was that our unit’s serial number had been mislabeled. Someone else out there has our number, we got theirs. This took a bit of back and forth but Ben set us straight with the correct serial number and we made it past this second hurdle.
The rest of the setup went fine until we got to the calibration step. If you are monitoring solar generation, then the system needs to determine the direction of the power inputs. They have a nice wizard to lead you through the process. It involved turning off the solar switch, running the calibration, then switching the solar back on and running the calibration again. As the eMonitor knowledge base article describes, it is a fairly complex thing to determine. In the end, we realized we had placed the main feed monitors downstream of the solar tie-ins, confusing the calibration. Ben once again came to the rescue and fixed everything from his end after I moved the sensors.
Everything appears to be working now.
The Dashboard, exporting data and mobile support
The eMonitor dashboard does not appear to work on the iPad. There is no app for the iPad and it doesn’t work in Safari. I logged in and got a blank page. The iPhone app is good, but it doesn’t break out unmonitored power. It also doesn’t change with the orientation of the phone to display more data or real-estate for the charts which are very static. You can’t zoom or change the parameters being charted.
On the desktop I find the energy dashboard navigation, page layout, and charting a bit clunky and old, but I’m an interface designer, so I expect a bit more from my apps, especially when I pay $280 dollars just for online access to my data. The charts in particular are quite small. I also would like to see the energy monitor website login remember my username, and offer me the option to keep me logged in for some period of time like most browser-based email applications. It’s annoying to have to keep logging in throughout the day.
As a final note, the export function could be a bit better. The export includes columns for 44 sensors even if you only have the 14 channel model. And the downloaded file contains an .XLS extension even though it is an CSV (comma delimited) file. CSV would be perfectly fine for both Excel and lots of other applications that read comma delimited data. I’m also not looking forward to having to download this data manually. Our TED made it easy to get historical data directly from the gateway. I’m not sure if eMonitor works the same way.
My next task is to figure out how to download data directly from the gateway and display the data in my own spreadsheets and charts which look much better and allow me to include my HOBO sensor temperature data.
Our thanks to Sage at EnergyCircle and Ben at Powerhouse Dynamics for helping us through the kinks. It’s really wonderful to see the breakdown by appliance, particularly the ASHP, water heater and well pump. More fun with charts at the end of the month.

Categories
- Air sealing 13
- Appliances & Fixtures 4
- Art 3
- Award 4
- Bathroom 8
- Batteries 1
- Decor 5
- Design 10
- Electrical 5
- Energy Calculations 13
- Energy Monitors 4
- Farm 1
- Finance 1
- Flooring 3
- Foundation 9
- Framing 8
- Heating 9
- House 7
- Insulation 8
- Kitchen 6
- Landscaping 3
- Lessons Learned 1
- Performance 60
- Plumbing 10
- Porch 5
- Radon 1
- Rainwater catchment 3
- Research / study 1
- Roof 7
- Septic / Waste water 2
- Sheetrock 6
- Siding 9
- Site Work 22
- Smart home 1
- Solar 64
- Solar Obsessed 10
- Stairs 2
- Surveying 3
- Ventilation 8
- Weather 1
- Windows & Doors 14
- plug-in 3
Archive
- Jan 2021 1
- Dec 2020 2
- May 2020 1
- Jan 2020 1
- May 2019 1
- Jan 2019 3
- Sep 2018 2
- Aug 2018 2
- Jan 2018 1
- Oct 2017 2
- Apr 2017 1
- Jan 2017 1
- Oct 2016 2
- Aug 2016 1
- Apr 2016 2
- Jan 2016 2
- Nov 2015 2
- Oct 2015 1
- Jul 2015 1
- May 2015 1
- Apr 2015 1
- Jan 2015 1
- Dec 2014 1
- Nov 2014 2
- Oct 2014 4
- Sep 2014 2
- Aug 2014 1
- Jul 2014 1
- Mar 2014 3
- Feb 2014 2
- Jan 2014 2
- Nov 2013 1
- Oct 2013 1
- Sep 2013 1
- Jul 2013 3
- Apr 2013 3
- Jan 2013 3
- Dec 2012 2
- Nov 2012 3
- Oct 2012 1
- Sep 2012 3
- Aug 2012 3
- Jul 2012 2
- Jun 2012 1
- May 2012 3
- Apr 2012 2
- Mar 2012 4
- Feb 2012 4
- Jan 2012 5
- Dec 2011 4
- Nov 2011 9
- Oct 2011 10
- Sep 2011 9
- Aug 2011 6
- Jul 2011 6
- Jun 2011 12
- May 2011 8
- Apr 2011 4
- Mar 2011 5
- Jan 2011 6
- Dec 2010 9
- Nov 2010 3
- Oct 2010 4
- Sep 2010 6
- Aug 2010 8
- Jul 2010 6
- Jun 2010 3
- May 2010 3
- Apr 2010 1
- Mar 2010 3
- Feb 2010 3
- Dec 2009 1
- Jun 2009 1
- May 2009 1
- Feb 2009 1
- Dec 2008 1
- Nov 2008 1
- Jun 2008 1