
July performance
We generated 970 kWh in July, up 3% from last month. That is our best month yet, but in line with last month’s daily average of 31.3 kWh. We used 319 kWh, 5% less per day on average than last month. We turned on the air conditioning for 3 days during a particularly humid run, and periodically for a few days the next week. We used 12 kWh for cooling / dehumidification, 8% of our month’s total usage. We generated a 651 kWh surplus this month, our 5th surplus month in a row and highest yet.
| Jan 1 | Feb 2 | Mar 6 | Apr 7 | May | Jun | Jul | |
|---|---|---|---|---|---|---|---|
| Solar PV production | 369 | 597 | 860 | 925 | 867 | 939 | 970 |
| Usage | 873 | 666 | 515 | 378 | 309 | 325 | 319 |
| Net usage or (surplus) | 504 | 69 | (345) | (538) | (558) | (614) | (651) |
| Avg. daily usage | 28.2 | 23.0 | 16.6 | 12.9 | 10.0 | 10.8 | 10.3 |
| HDD 3,4 | 1,212 5 | 1,045 | 704 | 617 | 298 | 144 | 34 |
I also did some number crunching this month to start tracking the efficiency of our water pump over time. We track the water pump electrical usage and the number of gallons of cold and hot water we use each month. We’re currently using 2.6-2.7 watt hours per gallon of water pumped from the well. That’s roughly 374 gallons per kWh. I’m curious if that is a good number or not? I’ll have to do some research.
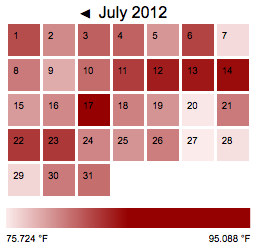
The image at the top of the post shows a heat map of the high temps of the month. The average temperature in July was 73.6F, up 7F from June. You can see heat maps and detailed charts of temperature and electrical usage at netplusdesign.com. View solar, usage, net usage, temperatures and HDD for all of February and circuit-level data for 16 days in March and the full months of April through July.

Categories
- Air sealing 13
- Appliances & Fixtures 4
- Art 3
- Award 4
- Bathroom 8
- Batteries 1
- Decor 5
- Design 10
- Electrical 5
- Energy Calculations 13
- Energy Monitors 4
- Farm 1
- Finance 1
- Flooring 3
- Foundation 9
- Framing 8
- Heating 9
- House 7
- Insulation 8
- Kitchen 6
- Landscaping 3
- Lessons Learned 1
- Performance 60
- Plumbing 10
- Porch 5
- Radon 1
- Rainwater catchment 3
- Research / study 1
- Roof 7
- Septic / Waste water 2
- Sheetrock 6
- Siding 9
- Site Work 22
- Smart home 1
- Solar 64
- Solar Obsessed 10
- Stairs 2
- Surveying 3
- Ventilation 8
- Weather 1
- Windows & Doors 14
- plug-in 3
Archive
- Jan 2021 1
- Dec 2020 2
- May 2020 1
- Jan 2020 1
- May 2019 1
- Jan 2019 3
- Sep 2018 2
- Aug 2018 2
- Jan 2018 1
- Oct 2017 2
- Apr 2017 1
- Jan 2017 1
- Oct 2016 2
- Aug 2016 1
- Apr 2016 2
- Jan 2016 2
- Nov 2015 2
- Oct 2015 1
- Jul 2015 1
- May 2015 1
- Apr 2015 1
- Jan 2015 1
- Dec 2014 1
- Nov 2014 2
- Oct 2014 4
- Sep 2014 2
- Aug 2014 1
- Jul 2014 1
- Mar 2014 3
- Feb 2014 2
- Jan 2014 2
- Nov 2013 1
- Oct 2013 1
- Sep 2013 1
- Jul 2013 3
- Apr 2013 3
- Jan 2013 3
- Dec 2012 2
- Nov 2012 3
- Oct 2012 1
- Sep 2012 3
- Aug 2012 3
- Jul 2012 2
- Jun 2012 1
- May 2012 3
- Apr 2012 2
- Mar 2012 4
- Feb 2012 4
- Jan 2012 5
- Dec 2011 4
- Nov 2011 9
- Oct 2011 10
- Sep 2011 9
- Aug 2011 6
- Jul 2011 6
- Jun 2011 12
- May 2011 8
- Apr 2011 4
- Mar 2011 5
- Jan 2011 6
- Dec 2010 9
- Nov 2010 3
- Oct 2010 4
- Sep 2010 6
- Aug 2010 8
- Jul 2010 6
- Jun 2010 3
- May 2010 3
- Apr 2010 1
- Mar 2010 3
- Feb 2010 3
- Dec 2009 1
- Jun 2009 1
- May 2009 1
- Feb 2009 1
- Dec 2008 1
- Nov 2008 1
- Jun 2008 1