
September performance
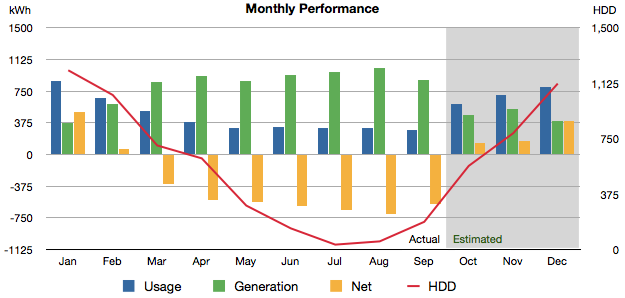
Fall weather arrived last month. More rain and clouds with cooler nights. We generated 883 kWh in September, down 15% from last month, but still about 37 kWh better than predicted. We generated on average 29.4 kWh per day.
We used 292 kWh, our lowest month yet. That’s down 7% from the previous month. We used the air conditioning only 2 days and heating for 1 day. We used 9.5 kWh for cooling / dehumidification, and 5.9 kWh for heating. Together that’s 5% of our month’s total usage. We generated a 591 kWh surplus this month, our 7th surplus month in a row.
I changed the format of the table a bit. Months now run down the table instead of across.
| Month | Solar PV | Usage | Net usage or (surplus) | Avg. daily usage | HDD 3,4 |
|---|---|---|---|---|---|
| Jan 1 | 369 | 873 | 504 | 28.2 | 1,212 5 |
| Feb 2 | 597 | 666 | 69 | 23.0 | 1,045 |
| Mar 6 | 860 | 515 | (345) | 16.6 | 704 |
| Apr 7 | 925 | 378 | (538) | 12.9 | 617 |
| May | 867 | 309 | (558) | 10.0 | 298 |
| Jun | 939 | 325 | (614) | 10.8 | 144 |
| Jul | 970 | 319 | (651) | 10.3 | 34 |
| Aug | 1,018 | 315 | (703) | 10.2 | 56 |
| Sep | 883 | 292 | (591) | 9.7 | 188 |
All values in kWh (except HDD).
- January values based on meter reads.
- February values based on TED data.
- Heating Degree Days, a measure of how many outside degrees in a day it is below a base target inside temperature, 68F.
- Calculated from our HOBO outdoor weather monitor hourly data, unless otherwise noted.
- January HDD data downloaded from degreedays.net, Station ID: KALB (Albany International Airport).
- March values based on meter reads. (TED died March 1st, eMonitor installed March 16, 2012)
- Values starting in April are based on eMonitor data.
Again I was surprised that our usage for the month was lower than last month. The big energy saver this month was less need for cooling and dehumidification. Most of the canning was finished last month. We added a freezer in the basement last month. So far it has not appeared to impact our daily usage by a noticeable amount.
The number of hours we experienced temperature values below 68F increased to 188 HDD, right on average for September in our area. Our water usage is also back down to a more normal non-summer range of 43.8 gallons per day.
You can see heat maps and detailed charts of temperature and electrical usage at netplusdesign.com. View solar, usage, net usage, temperatures and HDD for all of February and circuit-level data for 16 days in March and the full months of April through September.

Categories
- Air sealing 13
- Appliances & Fixtures 4
- Art 3
- Award 4
- Bathroom 8
- Batteries 1
- Decor 5
- Design 10
- Electrical 5
- Energy Calculations 13
- Energy Monitors 4
- Farm 1
- Finance 1
- Flooring 3
- Foundation 9
- Framing 8
- Heating 9
- House 7
- Insulation 8
- Kitchen 6
- Landscaping 3
- Lessons Learned 1
- Performance 60
- Plumbing 10
- Porch 5
- Radon 1
- Rainwater catchment 3
- Research / study 1
- Roof 7
- Septic / Waste water 2
- Sheetrock 6
- Siding 9
- Site Work 22
- Smart home 1
- Solar 64
- Solar Obsessed 10
- Stairs 2
- Surveying 3
- Ventilation 8
- Weather 1
- Windows & Doors 14
- plug-in 3
Archive
- Jan 2021 1
- Dec 2020 2
- May 2020 1
- Jan 2020 1
- May 2019 1
- Jan 2019 3
- Sep 2018 2
- Aug 2018 2
- Jan 2018 1
- Oct 2017 2
- Apr 2017 1
- Jan 2017 1
- Oct 2016 2
- Aug 2016 1
- Apr 2016 2
- Jan 2016 2
- Nov 2015 2
- Oct 2015 1
- Jul 2015 1
- May 2015 1
- Apr 2015 1
- Jan 2015 1
- Dec 2014 1
- Nov 2014 2
- Oct 2014 4
- Sep 2014 2
- Aug 2014 1
- Jul 2014 1
- Mar 2014 3
- Feb 2014 2
- Jan 2014 2
- Nov 2013 1
- Oct 2013 1
- Sep 2013 1
- Jul 2013 3
- Apr 2013 3
- Jan 2013 3
- Dec 2012 2
- Nov 2012 3
- Oct 2012 1
- Sep 2012 3
- Aug 2012 3
- Jul 2012 2
- Jun 2012 1
- May 2012 3
- Apr 2012 2
- Mar 2012 4
- Feb 2012 4
- Jan 2012 5
- Dec 2011 4
- Nov 2011 9
- Oct 2011 10
- Sep 2011 9
- Aug 2011 6
- Jul 2011 6
- Jun 2011 12
- May 2011 8
- Apr 2011 4
- Mar 2011 5
- Jan 2011 6
- Dec 2010 9
- Nov 2010 3
- Oct 2010 4
- Sep 2010 6
- Aug 2010 8
- Jul 2010 6
- Jun 2010 3
- May 2010 3
- Apr 2010 1
- Mar 2010 3
- Feb 2010 3
- Dec 2009 1
- Jun 2009 1
- May 2009 1
- Feb 2009 1
- Dec 2008 1
- Nov 2008 1
- Jun 2008 1