
October performance
October was overshadowed by the events of the last week. Despite the best efforts of Hurricane Sandy we are safe and dry at Up Hill House. We had plenty of strong wind gusts, but not nearly as bad as the costal regions. We were prepared for the worst. We stocked up on water and easy to prepare meals. We have a small propane burner that can be used to heat water or simple cooking. We packed the chest freezer with ice. We filled the bathtub for flushing and the cistern was full for the farm critters. Thankfully the power never went out.
October was considerably more cloudy. We only generated 511 kWh, down 73% from September, but still about 43 kWh better than predicted.
We used 433 kWh, our highest month since March. That’s up 48% from the previous month. We turned on the heating for a 27 hour stretch starting on October 3rd at 3pm, although I can’t remember why. It wasn’t particularly cold inside or out. We used a total of 6.3 kWh for those 27 hours. That only accounts for 1.5% of our month’s total usage. The big increase was due to washing dishes, cloths and cooking (256 kWh versus 164 kWh the previous month). I like to refer to this as the mother-in-law effect. Unfortunately we were not able to use the clothes line this month due to lady bug beetle swarms.
Despite the lower solar generation and the higher usage, we still managed to squeak out a 78 kWh surplus this month, our 8th surplus month in a row, and likely our last for the year. We’re still on track to produce more than we use in our first year.
The number of hours we experienced temperature values below 68F increased to 446 HDD, slightly milder than average for October in our area. Our water usage increased this month, due to extra wash loads and additional water we stored in case we lost power during Sandy. We averaged 65.6 gallons per day.
| Month | Solar PV | Usage | Net usage or (surplus) | Avg. daily usage | HDD 3,4 |
|---|---|---|---|---|---|
| Jan 1 | 369 | 873 | 504 | 28.2 | 1,212 5 |
| Feb 2 | 597 | 666 | 69 | 23.0 | 1,045 |
| Mar 6 | 860 | 515 | (345) | 16.6 | 704 |
| Apr 7 | 925 | 378 | (538) | 12.9 | 617 |
| May | 867 | 309 | (558) | 10.0 | 298 |
| Jun | 939 | 325 | (614) | 10.8 | 144 |
| Jul | 970 | 319 | (651) | 10.3 | 34 |
| Aug | 1,018 | 315 | (703) | 10.2 | 56 |
| Sep | 883 | 292 | (591) | 9.7 | 188 |
| Oct | 511 | 433 | (78) | 14.0 | 446 |
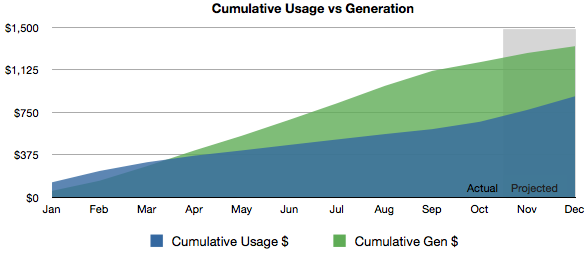
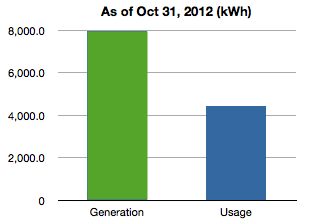
I put this chart together for the Green Building Open House Tour. I wanted to show in dollars, how much power we’ve used and how much we’ve generated since we moved in at the beginning of the year. As of the end of October, we’ve used 4,434 kWh and generated 7,939 kWh. At roughly $0.15 per kWh that works out to $665 in electricity usage versus $1,191 for electricity produced. Of course we don’t get 15 cents a kWh when we sell it back to the grid, but it illustrates that we’re accumulating value faster than we’re spending it over the year.
You can see heat maps and detailed charts of temperature and electrical usage at netplusdesign.com. View solar, usage, net usage, temperatures and HDD for all of February and circuit-level data for 16 days in March and the full months of April through October.

Categories
- Air sealing 13
- Appliances & Fixtures 4
- Art 3
- Award 4
- Bathroom 8
- Batteries 1
- Decor 5
- Design 10
- Electrical 5
- Energy Calculations 13
- Energy Monitors 4
- Farm 1
- Finance 1
- Flooring 3
- Foundation 9
- Framing 8
- Heating 9
- House 7
- Insulation 8
- Kitchen 6
- Landscaping 3
- Lessons Learned 1
- Performance 60
- Plumbing 10
- Porch 5
- Radon 1
- Rainwater catchment 3
- Research / study 1
- Roof 7
- Septic / Waste water 2
- Sheetrock 6
- Siding 9
- Site Work 22
- Smart home 1
- Solar 64
- Solar Obsessed 10
- Stairs 2
- Surveying 3
- Ventilation 8
- Weather 1
- Windows & Doors 14
- plug-in 3
Archive
- Jan 2021 1
- Dec 2020 2
- May 2020 1
- Jan 2020 1
- May 2019 1
- Jan 2019 3
- Sep 2018 2
- Aug 2018 2
- Jan 2018 1
- Oct 2017 2
- Apr 2017 1
- Jan 2017 1
- Oct 2016 2
- Aug 2016 1
- Apr 2016 2
- Jan 2016 2
- Nov 2015 2
- Oct 2015 1
- Jul 2015 1
- May 2015 1
- Apr 2015 1
- Jan 2015 1
- Dec 2014 1
- Nov 2014 2
- Oct 2014 4
- Sep 2014 2
- Aug 2014 1
- Jul 2014 1
- Mar 2014 3
- Feb 2014 2
- Jan 2014 2
- Nov 2013 1
- Oct 2013 1
- Sep 2013 1
- Jul 2013 3
- Apr 2013 3
- Jan 2013 3
- Dec 2012 2
- Nov 2012 3
- Oct 2012 1
- Sep 2012 3
- Aug 2012 3
- Jul 2012 2
- Jun 2012 1
- May 2012 3
- Apr 2012 2
- Mar 2012 4
- Feb 2012 4
- Jan 2012 5
- Dec 2011 4
- Nov 2011 9
- Oct 2011 10
- Sep 2011 9
- Aug 2011 6
- Jul 2011 6
- Jun 2011 12
- May 2011 8
- Apr 2011 4
- Mar 2011 5
- Jan 2011 6
- Dec 2010 9
- Nov 2010 3
- Oct 2010 4
- Sep 2010 6
- Aug 2010 8
- Jul 2010 6
- Jun 2010 3
- May 2010 3
- Apr 2010 1
- Mar 2010 3
- Feb 2010 3
- Dec 2009 1
- Jun 2009 1
- May 2009 1
- Feb 2009 1
- Dec 2008 1
- Nov 2008 1
- Jun 2008 1