
Temperature and energy use observations
As I continue sifting through our performance data, I’ve been focusing lately on outdoor temperatures and their relationship with our heating and cooling energy use. These are a few of my observations.
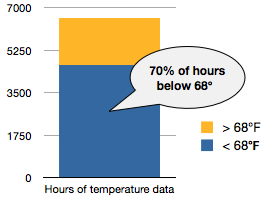
We have 9 months, 274 days, 6,576 hours of temperature data, from February 1 to October 31. Of those 6,576 hours, 4,635 outdoor temperature hours were below 68 degrees F. Roughly 70% of the recorded time period has been below 68 degrees F.
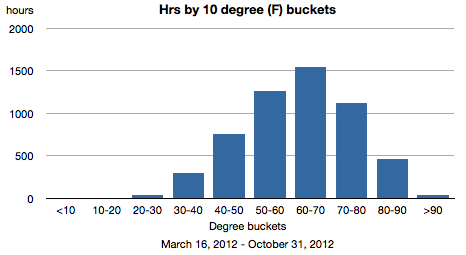
Breaking out the temperatures by 10 degree buckets you can see a rough bell curve. The majority of hours were in the 60-70 degree F range. The next three months of data will add more hours to the 60 degree and below buckets.
If we overlay air-source heat pump values on the same chart (below), we can see the power used for heating and cooling based on the temperature ranges. The dip in the 50-60 degree range is likely to indicate our base building temperature.
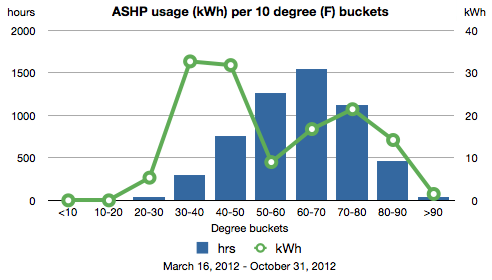
The dip is where we shift from heating to cooling or dehumidification in our case. I really should plot the right side with interior humidity ranges rather than temperature ranges. I’m guessing the hottest days were more dry and less likely for us to use the AC.
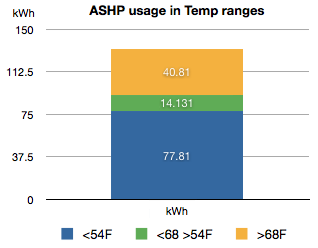
We used the majority of our heat energy for temperatures below 54F degrees. This makes sense, but when I looked at the hours the heat was on in the two temperature ranges I saw something I didn’t expect.
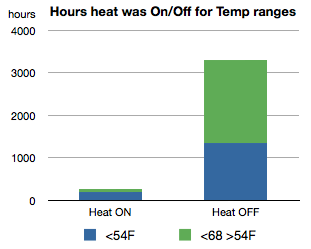
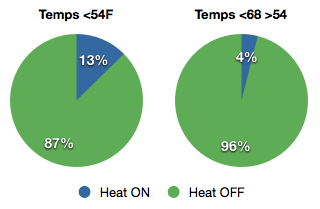
The heat was only ON for for a small proportion of the hours that temperatures were below 54F degrees. It was off more than it was on. After I mulled this over it made sense too. A lot of spring, summer and fall nights can get quite cool, but the insulation and mass of the house keeps it warm through the night. Plus, we generally keep the heat turned off in the summer for obvious reasons.
But it made me curious what types of temperature swings we were experiencing monthly.
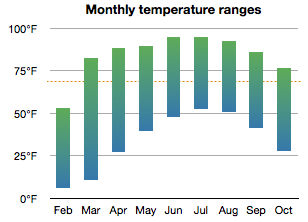
There is quite a range of temperatures throughout the months, March being the extreme due to a freakishly warm spell. The dotted line is 68F. This shows we’re getting some cool nights all through the summer.
That’s it for this week.
Notes
Number of kWh used for heating below 54F = 77.81 kWh
Number of kWh used for heating between 54F and 68F = 14.131 kWh
Number of hours heating was ON when temperatures were below 54F = 195 hrs
Number of hours heating was ON when temperatures were between 54F and 68F = 80 hrs
Number of hours heating was OFF when temperatures were below 54F = 1,351 hrs
Number of hours heating was OFF when temperatures were between 54F and 68F = 1,958 hrs
Heat was ON 6% of the total hours that temps were below 68F. In that time we used 91.941 kWh for heat, an average of 334 Wh/hr.
Heat was ON 14% of the total hours that temps were below 54F. In that time we used 77.81 kWh for heat. 82% of total heat usage, an average of 399 Wh/hr.
Heat was ON 4% of the total hours that temps were between 54F and 68F. In that time we used 14.131 kWh for heat. 18% of total heat usage, an average of 177 Wh/hr.
Temps were above 68F = 1,941 hrs
Temps were below 68F = 4,635 hrs
Temps were between 54F and 68F = 80 hrs
Hours temps were below 54F = 1,351 hrs

Categories
- Air sealing 13
- Appliances & Fixtures 4
- Art 3
- Award 4
- Bathroom 8
- Batteries 1
- Decor 5
- Design 10
- Electrical 5
- Energy Calculations 13
- Energy Monitors 4
- Farm 1
- Finance 1
- Flooring 3
- Foundation 9
- Framing 8
- Heating 9
- House 7
- Insulation 8
- Kitchen 6
- Landscaping 3
- Lessons Learned 1
- Performance 60
- Plumbing 10
- Porch 5
- Radon 1
- Rainwater catchment 3
- Research / study 1
- Roof 7
- Septic / Waste water 2
- Sheetrock 6
- Siding 9
- Site Work 22
- Smart home 1
- Solar 64
- Solar Obsessed 10
- Stairs 2
- Surveying 3
- Ventilation 8
- Weather 1
- Windows & Doors 14
- plug-in 3
Archive
- Jan 2021 1
- Dec 2020 2
- May 2020 1
- Jan 2020 1
- May 2019 1
- Jan 2019 3
- Sep 2018 2
- Aug 2018 2
- Jan 2018 1
- Oct 2017 2
- Apr 2017 1
- Jan 2017 1
- Oct 2016 2
- Aug 2016 1
- Apr 2016 2
- Jan 2016 2
- Nov 2015 2
- Oct 2015 1
- Jul 2015 1
- May 2015 1
- Apr 2015 1
- Jan 2015 1
- Dec 2014 1
- Nov 2014 2
- Oct 2014 4
- Sep 2014 2
- Aug 2014 1
- Jul 2014 1
- Mar 2014 3
- Feb 2014 2
- Jan 2014 2
- Nov 2013 1
- Oct 2013 1
- Sep 2013 1
- Jul 2013 3
- Apr 2013 3
- Jan 2013 3
- Dec 2012 2
- Nov 2012 3
- Oct 2012 1
- Sep 2012 3
- Aug 2012 3
- Jul 2012 2
- Jun 2012 1
- May 2012 3
- Apr 2012 2
- Mar 2012 4
- Feb 2012 4
- Jan 2012 5
- Dec 2011 4
- Nov 2011 9
- Oct 2011 10
- Sep 2011 9
- Aug 2011 6
- Jul 2011 6
- Jun 2011 12
- May 2011 8
- Apr 2011 4
- Mar 2011 5
- Jan 2011 6
- Dec 2010 9
- Nov 2010 3
- Oct 2010 4
- Sep 2010 6
- Aug 2010 8
- Jul 2010 6
- Jun 2010 3
- May 2010 3
- Apr 2010 1
- Mar 2010 3
- Feb 2010 3
- Dec 2009 1
- Jun 2009 1
- May 2009 1
- Feb 2009 1
- Dec 2008 1
- Nov 2008 1
- Jun 2008 1