
Correlating HDD with heating energy use
I spent a few of the Sandy storm days indoors and decided to indulge my inner nerd. I’ve been tracking all our house performance data using monthly spreadsheets, which can make it difficult to filter data or look for trends across months. So I downloaded mySQL and imported all our energy and temperature data into the database. This is the first in a series of posts on what I find as I sift through the data.
A while back I stumbled upon this article, Linear Regression Analysis of Energy Consumption Data. At the time I was learning about how to calculate HDD days based on our own temperature data captured by our outdoor HOBO temperature and humidity sensor. Now that our data is much easier to query I decided to give the linear regression analysis a try.
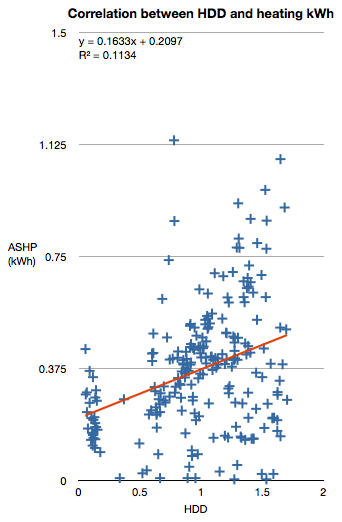
The main idea is that if we plot energy used to heat our house on one axis and HDD on the other (and we’re extremely lucky) we should be able to see a fairly consistent pattern. Meaning we could use the results of the analysis to predict how much energy will be required in the future if we know the probability of HDD for a future time period.
The R2 value of 0.1134 in the chart at the top of the page tells us that we don’t have a strong correlation between energy use and HDD. The closer the R2 value gets to 1, the stronger the correlation. So what could be the reasons that we don’t have a stronger correlation?
One reason may be that an air source heat pump uses different amounts of energy to make heat depending on the outside air temperature. It has to work harder at lower temperatures to generate the same amount of heat.
It may also have something to do with how the HDD values are selected. I started with daily snapshots, but there could be 23 HDD in a 24 hour day, and the ASHP only operated for a few of those hours, either because we turned it off at night or we experienced a day with a lot of sun. So I switched to hourly snapshots and discarded any hours where the ASHP was not drawing power (the result is the chart at top of page). This however, did not result in a closer correlation.
My guess is that we don’t use the heat in a consistent manner so we’d have a difficult time getting a strong correlation. Plus, the way the heat pump itself works may also make it difficult to correlate.

Categories
- Air sealing 13
- Appliances & Fixtures 4
- Art 3
- Award 4
- Bathroom 8
- Batteries 1
- Decor 5
- Design 10
- Electrical 5
- Energy Calculations 13
- Energy Monitors 4
- Farm 1
- Finance 1
- Flooring 3
- Foundation 9
- Framing 8
- Heating 9
- House 7
- Insulation 8
- Kitchen 6
- Landscaping 3
- Lessons Learned 1
- Performance 60
- Plumbing 10
- Porch 5
- Radon 1
- Rainwater catchment 3
- Research / study 1
- Roof 7
- Septic / Waste water 2
- Sheetrock 6
- Siding 9
- Site Work 22
- Smart home 1
- Solar 64
- Solar Obsessed 10
- Stairs 2
- Surveying 3
- Ventilation 8
- Weather 1
- Windows & Doors 14
- plug-in 3
Archive
- Jan 2021 1
- Dec 2020 2
- May 2020 1
- Jan 2020 1
- May 2019 1
- Jan 2019 3
- Sep 2018 2
- Aug 2018 2
- Jan 2018 1
- Oct 2017 2
- Apr 2017 1
- Jan 2017 1
- Oct 2016 2
- Aug 2016 1
- Apr 2016 2
- Jan 2016 2
- Nov 2015 2
- Oct 2015 1
- Jul 2015 1
- May 2015 1
- Apr 2015 1
- Jan 2015 1
- Dec 2014 1
- Nov 2014 2
- Oct 2014 4
- Sep 2014 2
- Aug 2014 1
- Jul 2014 1
- Mar 2014 3
- Feb 2014 2
- Jan 2014 2
- Nov 2013 1
- Oct 2013 1
- Sep 2013 1
- Jul 2013 3
- Apr 2013 3
- Jan 2013 3
- Dec 2012 2
- Nov 2012 3
- Oct 2012 1
- Sep 2012 3
- Aug 2012 3
- Jul 2012 2
- Jun 2012 1
- May 2012 3
- Apr 2012 2
- Mar 2012 4
- Feb 2012 4
- Jan 2012 5
- Dec 2011 4
- Nov 2011 9
- Oct 2011 10
- Sep 2011 9
- Aug 2011 6
- Jul 2011 6
- Jun 2011 12
- May 2011 8
- Apr 2011 4
- Mar 2011 5
- Jan 2011 6
- Dec 2010 9
- Nov 2010 3
- Oct 2010 4
- Sep 2010 6
- Aug 2010 8
- Jul 2010 6
- Jun 2010 3
- May 2010 3
- Apr 2010 1
- Mar 2010 3
- Feb 2010 3
- Dec 2009 1
- Jun 2009 1
- May 2009 1
- Feb 2009 1
- Dec 2008 1
- Nov 2008 1
- Jun 2008 1