
We're net positive for 2012!

Year Summary
We’re net positive for 2012! We used 5,601 kWh and generated 8,856 kWh for a net surplus of 3,256 kWh. We used an average of 15.3 kWh per day.
We’re within 6% of our projected energy use of 5,950 kWh for the year. It also looks like we used about 80% of the estimated 2,440 kWh for hot water energy. It’s too early to tell how we’re doing against our heat energy estimate since we missed recording the primary heating season. We should know better by mid-March.
But we can calculate the current BTU/SF/HDD, which is a common measure to compare the efficiency of houses of different sizes and climates. First we need to know the total heating degree days (HDD) and heat energy usage for the period we have data. We recorded 5,885 HDD (base 65F) for 2012. 3,434.800 HDD were recorded when we had circuit level data for the ASHP, which used 277.331 kWh for heating in that period.
Now we convert kWh to BTUs, 277.331 kWh * 3412.14163 (kWh to BTU conversion factor) then divide by 1408 SF and divide again by 3,434.800 HDD (March 16-Dec 31, 2012) = 0.196. This is not a completely accurate number as it does not include Jan 1 through March 15, but soon we will have a full year of circuit level data and a more representative number.
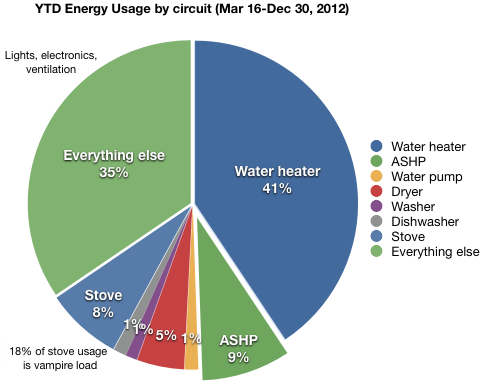
We used an average of 56 gallons of water per day. 34% of our total water usage was hot water. For the time period we have circuit level data that works out to 258 watts per gallon of hot water. I’ve found some estimates on the web that say we should be using about half that wattage to heat our water, so we’re going to do a bit more investigation.
December Summary
In December, we used 668 kWh and generated 302 kWh for a net deficit of 366 kWh. We had nine consecutive surplus months. This is the first month since February that we used more than we generated.
We used 152 kWh for heat, a 227% increase over November. Dividing 152 kWh by 979 HDD we get 155 watts per HDD. That’s a 182% increase from November. Not only are we using the heat more, but the heat pump has to work harder because it’s colder outside. Heating accounts for 22% of the month’s total usage. Hot water accounted for 32% of the energy for the month. We used 65.9 gallons of water per day, up 7% from the previous month.
The largest energy increase in the last few months has been in the All Other category, followed by the water heater, ASHP and the stove. Most of this makes sense. We’re spending a lot more time indoors. The holidays bring visitors, more showers, more laundry and lots and lots of cooking!
We generated 302 kWh, roughly half of November’s production. It was down 24% from the estimated December value of 399 kWh. A very cloudy and snowy month. In fact we only generated 116 watts the last 5 days of the year due to snow blanketing the collectors.
| Usage | Solar PV | Net usage or (surplus) | Avg. daily usage | HDD 3,4 | |
|---|---|---|---|---|---|
| Total | 5,601 | 8,856 | (3,256) | 15.3 | 5,885 |
| Jan 1 | 873 | 369 | 504 | 28.2 | 1,125 5 |
| Feb 2 | 666 | 597 | 69 | 23.0 | 957 |
| Mar 6 | 515 | 860 | (345) | 16.6 | 619 |
| Apr 7 | 925 | 378 | (538) | 12.9 | 535 |
| May | 309 | 867 | (558) | 10.0 | 170 |
| Jun | 325 | 939 | (614) | 10.8 | 97 |
| Jul | 319 | 970 | (651) | 10.3 | 17 |
| Aug | 315 | 1,018 | (703) | 10.2 | 31 |
| Sep | 292 | 883 | (591) | 9.7 | 168 |
| Oct | 433 | 511 | (78) | 14.0 | 357 |
| Nov | 498 | 615 | (117) | 16.5 | 830 |
| Dec | 668 | 302 | 366 | 21.6 | 979 |
Next month we’ll start including information gathered from our two additional temperature/humidity sensors. We will now be able to see how temperatures differ from floor to floor.
You can see heat maps and detailed charts of temperature and electrical usage at netplusdesign.com. View solar, usage, net usage, temperatures and HDD for all of February and circuit-level data for 16 days in March and the full months of April through December.
Happy 2013 everyone!

Categories
- Air sealing 13
- Appliances & Fixtures 4
- Art 3
- Award 4
- Bathroom 8
- Batteries 1
- Decor 5
- Design 10
- Electrical 5
- Energy Calculations 13
- Energy Monitors 4
- Farm 1
- Finance 1
- Flooring 3
- Foundation 9
- Framing 8
- Heating 9
- House 7
- Insulation 8
- Kitchen 6
- Landscaping 3
- Lessons Learned 1
- Performance 60
- Plumbing 10
- Porch 5
- Radon 1
- Rainwater catchment 3
- Research / study 1
- Roof 7
- Septic / Waste water 2
- Sheetrock 6
- Siding 9
- Site Work 22
- Smart home 1
- Solar 64
- Solar Obsessed 10
- Stairs 2
- Surveying 3
- Ventilation 8
- Weather 1
- Windows & Doors 14
- plug-in 3
Archive
- Jan 2021 1
- Dec 2020 2
- May 2020 1
- Jan 2020 1
- May 2019 1
- Jan 2019 3
- Sep 2018 2
- Aug 2018 2
- Jan 2018 1
- Oct 2017 2
- Apr 2017 1
- Jan 2017 1
- Oct 2016 2
- Aug 2016 1
- Apr 2016 2
- Jan 2016 2
- Nov 2015 2
- Oct 2015 1
- Jul 2015 1
- May 2015 1
- Apr 2015 1
- Jan 2015 1
- Dec 2014 1
- Nov 2014 2
- Oct 2014 4
- Sep 2014 2
- Aug 2014 1
- Jul 2014 1
- Mar 2014 3
- Feb 2014 2
- Jan 2014 2
- Nov 2013 1
- Oct 2013 1
- Sep 2013 1
- Jul 2013 3
- Apr 2013 3
- Jan 2013 3
- Dec 2012 2
- Nov 2012 3
- Oct 2012 1
- Sep 2012 3
- Aug 2012 3
- Jul 2012 2
- Jun 2012 1
- May 2012 3
- Apr 2012 2
- Mar 2012 4
- Feb 2012 4
- Jan 2012 5
- Dec 2011 4
- Nov 2011 9
- Oct 2011 10
- Sep 2011 9
- Aug 2011 6
- Jul 2011 6
- Jun 2011 12
- May 2011 8
- Apr 2011 4
- Mar 2011 5
- Jan 2011 6
- Dec 2010 9
- Nov 2010 3
- Oct 2010 4
- Sep 2010 6
- Aug 2010 8
- Jul 2010 6
- Jun 2010 3
- May 2010 3
- Apr 2010 1
- Mar 2010 3
- Feb 2010 3
- Dec 2009 1
- Jun 2009 1
- May 2009 1
- Feb 2009 1
- Dec 2008 1
- Nov 2008 1
- Jun 2008 1