
Estimating heat energy for 2012
April 7 Update: Using a different method I estimated that we used 903 kWh for heat energy in 2012, that’s 16% of our total energy use. That would have cost us about $117 (using $0.13 per kWh).
We don’t have a full 12 months of data for our heat, but using heating degree days (HDD) and performance thus far we can estimate that we used 591 kWh (+/-20%) for heat in 2012. That’s 11% of our total energy use for the year.
Here’s the math…
Our estimate relies on heating degree day measurements. This discussion assumes you are comfortable with HDD. If not, we recommend this excellent article.
First we had to determine the optimal base temperature for our HDD. After some trial and error using a quick prototype, we determined that 50 degrees (F) most accurately predicted heat energy usage. This results in the following formula to calculate kWh.
kWh = 0.2261 * HDD + 0.756
To start, we know the ASHP used 283 kWh during the time period March 16-May, and September-December. We just need to estimate January through mid-March.
We started recording temperatures in February so let’s start there. There were 522 HDD (base 50F) in February.
119 kWh = 0.2261 * 522 HDD February + 0.756
For comparison, there were 518 HDD (base 50F) in December. We used 108 kWh in December for heat. That’s about 208 Wh/HDD. We could assume that we would have used about the same amount of energy in February, although we generated twice the amount of electricity in February, which means we would have used a lot less energy for heat because we were getting heat from the sun. But let’s use the more conservative estimate for now, 119 kWh.
We don’t have our own temperature data for January but we can use degreedays.net to find the HDD at any base temperature for January in our area. Albany International Airport has the closest matching temperatures. Using a base temperature of 50F degreedays tells us there were 654 HDD (base 50).
149 kWh = 0.2261 * 654 HDD January + 0.756
For comparison we could multiply the 208 Wh/HDD measure from December above times 654 HDD to get 138 kWh. This number is lower but since the temperatures were cooler in January than December we know the ASHP would have to work harder to make heat, so the higher number makes sense. January was about 23% cooler than December. If we add 23% to 138 kWh, we get 170 kWh. Not very scientific but if gives a sense of margin of error.
As for March, we only have the second half of the month’s data for the ASHP, which used 19 kWh. There were 90 HDD from March 16 through the end of the month. That’s 211 Wh/HDD. As a check we can plug 90 HDD into the formula to get the estimated kWh.
21 kWh = 0.2261 * 90 HDD + 0.756
It’s pretty close.
There were 174 HDD from March 1 to March 15.
40 kWh = 0.2261 * 174 HDD + 0.756
Again for comparison, 211 Wh/HDD (from above) * 174 HDD = 37 kWh. Pretty close, it was twice as cold and about twice the amount of energy use.
40 (3/1-3/15) + 19 (3/16-31) = 59 kWh total for March.
Now we can estimate our total heat energy for 2012.
283 (3/16-12/31) + 149 (Jan) + 119 (Feb) + 40 (for the missing part of March) = 591 kWh for 2012. That works out to $77 for heat, not counting delivery charges. 591 kWh represents 11% of our total energy use for the year. That seems about right since the ASHP represents 9% of our total energy use for the time period we have circuit level data.
There is at least a 20% margin of error for the estimate and that’s not even taking into account space heat energy contributed by the sun.
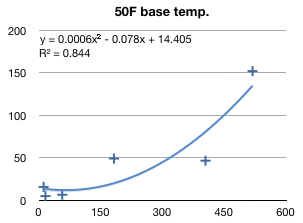
I’ve also been looking at a polynomial fitted curve to better estimate kWh based on HDD. This makes some sense because heat pumps are more efficient at higher temperatures and less efficient at lower temperatures. A linear regression analysis would not be able to capture that type of operating behavior.
- Note: Electricity supply cost calculated using the last bill we payed for electricity, May 2011.

Categories
- Air sealing 13
- Appliances & Fixtures 4
- Art 3
- Award 4
- Bathroom 8
- Batteries 1
- Decor 5
- Design 10
- Electrical 5
- Energy Calculations 13
- Energy Monitors 4
- Farm 1
- Finance 1
- Flooring 3
- Foundation 9
- Framing 8
- Heating 9
- House 7
- Insulation 8
- Kitchen 6
- Landscaping 3
- Lessons Learned 1
- Performance 60
- Plumbing 10
- Porch 5
- Radon 1
- Rainwater catchment 3
- Research / study 1
- Roof 7
- Septic / Waste water 2
- Sheetrock 6
- Siding 9
- Site Work 22
- Smart home 1
- Solar 64
- Solar Obsessed 10
- Stairs 2
- Surveying 3
- Ventilation 8
- Weather 1
- Windows & Doors 14
- plug-in 3
Archive
- Jan 2021 1
- Dec 2020 2
- May 2020 1
- Jan 2020 1
- May 2019 1
- Jan 2019 3
- Sep 2018 2
- Aug 2018 2
- Jan 2018 1
- Oct 2017 2
- Apr 2017 1
- Jan 2017 1
- Oct 2016 2
- Aug 2016 1
- Apr 2016 2
- Jan 2016 2
- Nov 2015 2
- Oct 2015 1
- Jul 2015 1
- May 2015 1
- Apr 2015 1
- Jan 2015 1
- Dec 2014 1
- Nov 2014 2
- Oct 2014 4
- Sep 2014 2
- Aug 2014 1
- Jul 2014 1
- Mar 2014 3
- Feb 2014 2
- Jan 2014 2
- Nov 2013 1
- Oct 2013 1
- Sep 2013 1
- Jul 2013 3
- Apr 2013 3
- Jan 2013 3
- Dec 2012 2
- Nov 2012 3
- Oct 2012 1
- Sep 2012 3
- Aug 2012 3
- Jul 2012 2
- Jun 2012 1
- May 2012 3
- Apr 2012 2
- Mar 2012 4
- Feb 2012 4
- Jan 2012 5
- Dec 2011 4
- Nov 2011 9
- Oct 2011 10
- Sep 2011 9
- Aug 2011 6
- Jul 2011 6
- Jun 2011 12
- May 2011 8
- Apr 2011 4
- Mar 2011 5
- Jan 2011 6
- Dec 2010 9
- Nov 2010 3
- Oct 2010 4
- Sep 2010 6
- Aug 2010 8
- Jul 2010 6
- Jun 2010 3
- May 2010 3
- Apr 2010 1
- Mar 2010 3
- Feb 2010 3
- Dec 2009 1
- Jun 2009 1
- May 2009 1
- Feb 2009 1
- Dec 2008 1
- Nov 2008 1
- Jun 2008 1