
Second quarter 2013 performance
Q2 2013 summary: 13% colder, 44% more usage and 4% less sun.
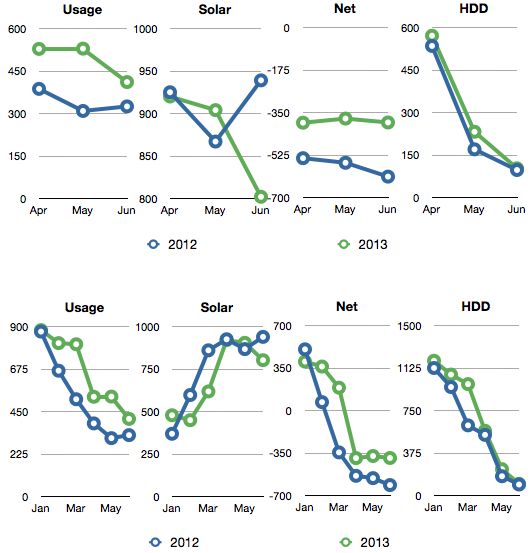
In Q2 last year our total usage was 1,021 kWh. This year is was 1,468 kWh, a 44% increase. Although it feels like it had rained a lot more this year then last, we only produced 4% less energy in Q2.
Overall, here’s how the first and second quarters compare to 2012.
| 2013 | Usage | Solar PV | Net usage or (surplus) | Avg. daily usage | HDD |
|---|---|---|---|---|---|
| Total | 1,468 | 2,626 | (1,158) | 16.1 | 906 |
| Apr | 528 | 920 | (392) | 17.6 | 571 |
| May | 529 | 904 | (375) | 17.1 | 232 |
| Jun | 411 | 802 | (391) | 13.7 | 103 |
| 2012 | Usage | Solar PV | Net usage or (surplus) | Avg. daily usage | HDD |
|---|---|---|---|---|---|
| Total | 1,021 | 2,731 | (1,709) | 11.2 | 802 |
| Apr | 387 | 925 | (538) | 12.9 | 535 |
| May | 309 | 867 | (557) | 10.0 | 170 |
| Jun | 325 | 939 | (614) | 10.8 | 97 |
Interesting note, we used 44% more energy this quarter as compared to 2012, but that was 447 kWh, or about the same as last quarter. We’re consistently using about 5 kWh extra per day than last year. This breaks down to 208 extra watts per hour. 100 watts is a heat lamp for the chick brooder, and the other 108 watts is roughly what my 2 laptops and task lighting use on average per hour.
Our water usage is only up 12%, and our hot water usage is down 3% from Q2 2012.
As for heating, we used the ASHP for roughly 14 hours in April for a total of 7.5 kWh.
In summary, Q2 usage is up compared to last year. That increase is attributed partially to the incubator and brooder box heat lamp (for the turkeys, chickens and guinea fowl), and partially to the increased use of the home office (last year I spent most of the summer building a barn, not staring at computers). We should be retiring the brooder box heat lamp this month, so I predict our next quarter usage will be up roughly 230 kWh from Q3 2012. Let’s see if my prediction holds.
You can see heat maps and detailed charts of temperature and electrical usage at netplusdesign.com. View hourly, daily and monthly values for solar, usage, net usage, temperatures and HDD.

Categories
- Air sealing 13
- Appliances & Fixtures 4
- Art 3
- Award 4
- Bathroom 8
- Batteries 1
- Decor 5
- Design 10
- Electrical 5
- Energy Calculations 13
- Energy Monitors 4
- Farm 1
- Finance 1
- Flooring 3
- Foundation 9
- Framing 8
- Heating 9
- House 7
- Insulation 8
- Kitchen 6
- Landscaping 3
- Lessons Learned 1
- Performance 60
- Plumbing 10
- Porch 5
- Radon 1
- Rainwater catchment 3
- Research / study 1
- Roof 7
- Septic / Waste water 2
- Sheetrock 6
- Siding 9
- Site Work 22
- Smart home 1
- Solar 64
- Solar Obsessed 10
- Stairs 2
- Surveying 3
- Ventilation 8
- Weather 1
- Windows & Doors 14
- plug-in 3
Archive
- Jan 2021 1
- Dec 2020 2
- May 2020 1
- Jan 2020 1
- May 2019 1
- Jan 2019 3
- Sep 2018 2
- Aug 2018 2
- Jan 2018 1
- Oct 2017 2
- Apr 2017 1
- Jan 2017 1
- Oct 2016 2
- Aug 2016 1
- Apr 2016 2
- Jan 2016 2
- Nov 2015 2
- Oct 2015 1
- Jul 2015 1
- May 2015 1
- Apr 2015 1
- Jan 2015 1
- Dec 2014 1
- Nov 2014 2
- Oct 2014 4
- Sep 2014 2
- Aug 2014 1
- Jul 2014 1
- Mar 2014 3
- Feb 2014 2
- Jan 2014 2
- Nov 2013 1
- Oct 2013 1
- Sep 2013 1
- Jul 2013 3
- Apr 2013 3
- Jan 2013 3
- Dec 2012 2
- Nov 2012 3
- Oct 2012 1
- Sep 2012 3
- Aug 2012 3
- Jul 2012 2
- Jun 2012 1
- May 2012 3
- Apr 2012 2
- Mar 2012 4
- Feb 2012 4
- Jan 2012 5
- Dec 2011 4
- Nov 2011 9
- Oct 2011 10
- Sep 2011 9
- Aug 2011 6
- Jul 2011 6
- Jun 2011 12
- May 2011 8
- Apr 2011 4
- Mar 2011 5
- Jan 2011 6
- Dec 2010 9
- Nov 2010 3
- Oct 2010 4
- Sep 2010 6
- Aug 2010 8
- Jul 2010 6
- Jun 2010 3
- May 2010 3
- Apr 2010 1
- Mar 2010 3
- Feb 2010 3
- Dec 2009 1
- Jun 2009 1
- May 2009 1
- Feb 2009 1
- Dec 2008 1
- Nov 2008 1
- Jun 2008 1