
72% of our usage is grid supplied, even though we produced more than we used!
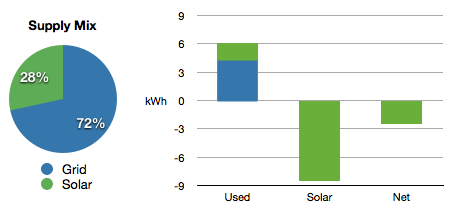
In the last year (April 1, 2012 to March 31, 2013), we used 6,046 kWh of electricity and produced 8,576 kWh for a net surplus of 2,530 kWh. That’s awesome right?
But 72% of the electricity we used was supplied by the grid when solar could not supply enough power to cover the need at that moment, like at night or on a cloudy day 1.
Or another way to look at it, although we produce more than we use, most of what we produce we don’t really use directly. We only use 28% of what we produce. The rest goes back to the grid to pay back what we used when the sun wasn’t shining and to build up a surplus for a rainy day.
So even with all that sun, we still draw a lot of power from the grid that requires coal and other nasties to be burnt to serve our electricity needs.
It makes sense, most of our heavy use, hot water for showers, cooking, washing dishes, all occurs early in the morning or evening when the sun is not at it’s brightest or best angle. The more we time our usage to occur when the sun is shining, the less we demand of the grid.
There has to be a common industry term for this? Anyone know? Percentage of power supplied by the grid as compared to total usage when solar or other renewable is in the mix?
To me this seems like a much more important number to track if you have solar and are concerned with your direct carbon producing footprint.
Notes:
1. In order to find how much energy we used from the grid I added up all the usage values on an hourly basis that were greater than what was being produced by solar. For example from 5-6am, total demand was 1000Wh. The sun was just coming up and the system was only producing 200Wh. That means the grid was supplied 800Wh during that time. 80% is grid supplied for this hour. Now do that for every hour in a year. Hint, it helps if all your energy values are stored in a database.

Categories
- Air sealing 13
- Appliances & Fixtures 4
- Art 3
- Award 4
- Bathroom 8
- Batteries 1
- Decor 5
- Design 10
- Electrical 5
- Energy Calculations 13
- Energy Monitors 4
- Farm 1
- Finance 1
- Flooring 3
- Foundation 9
- Framing 8
- Heating 9
- House 7
- Insulation 8
- Kitchen 6
- Landscaping 3
- Lessons Learned 1
- Performance 60
- Plumbing 10
- Porch 5
- Radon 1
- Rainwater catchment 3
- Research / study 1
- Roof 7
- Septic / Waste water 2
- Sheetrock 6
- Siding 9
- Site Work 22
- Smart home 1
- Solar 64
- Solar Obsessed 10
- Stairs 2
- Surveying 3
- Ventilation 8
- Weather 1
- Windows & Doors 14
- plug-in 3
Archive
- Jan 2021 1
- Dec 2020 2
- May 2020 1
- Jan 2020 1
- May 2019 1
- Jan 2019 3
- Sep 2018 2
- Aug 2018 2
- Jan 2018 1
- Oct 2017 2
- Apr 2017 1
- Jan 2017 1
- Oct 2016 2
- Aug 2016 1
- Apr 2016 2
- Jan 2016 2
- Nov 2015 2
- Oct 2015 1
- Jul 2015 1
- May 2015 1
- Apr 2015 1
- Jan 2015 1
- Dec 2014 1
- Nov 2014 2
- Oct 2014 4
- Sep 2014 2
- Aug 2014 1
- Jul 2014 1
- Mar 2014 3
- Feb 2014 2
- Jan 2014 2
- Nov 2013 1
- Oct 2013 1
- Sep 2013 1
- Jul 2013 3
- Apr 2013 3
- Jan 2013 3
- Dec 2012 2
- Nov 2012 3
- Oct 2012 1
- Sep 2012 3
- Aug 2012 3
- Jul 2012 2
- Jun 2012 1
- May 2012 3
- Apr 2012 2
- Mar 2012 4
- Feb 2012 4
- Jan 2012 5
- Dec 2011 4
- Nov 2011 9
- Oct 2011 10
- Sep 2011 9
- Aug 2011 6
- Jul 2011 6
- Jun 2011 12
- May 2011 8
- Apr 2011 4
- Mar 2011 5
- Jan 2011 6
- Dec 2010 9
- Nov 2010 3
- Oct 2010 4
- Sep 2010 6
- Aug 2010 8
- Jul 2010 6
- Jun 2010 3
- May 2010 3
- Apr 2010 1
- Mar 2010 3
- Feb 2010 3
- Dec 2009 1
- Jun 2009 1
- May 2009 1
- Feb 2009 1
- Dec 2008 1
- Nov 2008 1
- Jun 2008 1