
Second quarter 2015 performance
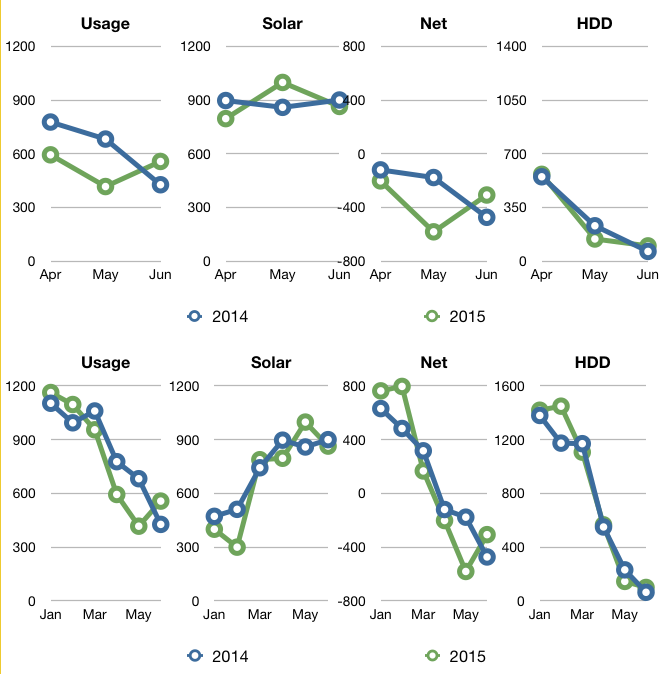
Q2 2015 summary: 4% cooler, 17% less usage and 2kWh more sun as compared to Q2 2014.
It is a wet, foggy and cold July 4th at Up Hill House. Perfect weather to update our quarterly numbers! And like today, this quarter was fairly uneventful. In energy terms, however, that is not a bad thing for us.
Overall, here’s how this quarter compared to 2014.
| 2014 | Usage | Solar PV | Net usage or (surplus) | Avg. daily usage | HDD |
|---|---|---|---|---|---|
| Total | 1,886 | 2,656 | (770) | 20.1 | 845 |
| Apr | 751 | 889 | (138) | 25.0 | 550 |
| May | 662 | 834 | (171) | 21.4 | 231 |
| Jun | 413 | 869 | (456) | 13.8 | 64 |
| 2015 | Usage | Solar PV | Net usage or (surplus) | Avg. daily usage | HDD |
|---|---|---|---|---|---|
| Total | 1,568 | 2,658 | (1,090) | 17.3 | 810 |
| Apr | 594 | 796 | (202) | 19.8 | 566 |
| May | 417 | 998 | (581) | 13.4 | 145 |
| Jun | 557 | 864 | (307) | 18.6 | 100 |
The last day we used heat was April 28 for a total of 151kWh this quarter. Last year we turned the heat off on April 5th and used 33 kWh that quarter.
We used a total of 2,200 kWh for heat for the winter of 2014-2015. At $0.15/kWh that’s $330. Last winter (13-14) we used 1,804 kWh or about $271. In the winter of 12-13, we used 957 kWh or $144.
We’re 637 kWh short of netting out for the year. Last year we netted out around mid-July. In years prior we were net positive by May or June.
Our water usage is down 13% from Q2 2014. I believe this is due to the short burst of summer-like weather in May and June. The warmer temps persuaded us to plant the garden a week earlier than usual, but then we lost most of the seedlings from the heat and lack of rain. We had to replant later in June. So while our region was suffering from unseasonably warm temperatures and a lack of rain, we had no garden to water.
Happy July 4th!

Categories
- Air sealing 13
- Appliances & Fixtures 4
- Art 3
- Award 4
- Bathroom 8
- Batteries 1
- Decor 5
- Design 10
- Electrical 5
- Energy Calculations 13
- Energy Monitors 4
- Farm 1
- Finance 1
- Flooring 3
- Foundation 9
- Framing 8
- Heating 9
- House 7
- Insulation 8
- Kitchen 6
- Landscaping 3
- Lessons Learned 1
- Performance 60
- Plumbing 10
- Porch 5
- Radon 1
- Rainwater catchment 3
- Research / study 1
- Roof 7
- Septic / Waste water 2
- Sheetrock 6
- Siding 9
- Site Work 22
- Smart home 1
- Solar 64
- Solar Obsessed 10
- Stairs 2
- Surveying 3
- Ventilation 8
- Weather 1
- Windows & Doors 14
- plug-in 3
Archive
- Jan 2021 1
- Dec 2020 2
- May 2020 1
- Jan 2020 1
- May 2019 1
- Jan 2019 3
- Sep 2018 2
- Aug 2018 2
- Jan 2018 1
- Oct 2017 2
- Apr 2017 1
- Jan 2017 1
- Oct 2016 2
- Aug 2016 1
- Apr 2016 2
- Jan 2016 2
- Nov 2015 2
- Oct 2015 1
- Jul 2015 1
- May 2015 1
- Apr 2015 1
- Jan 2015 1
- Dec 2014 1
- Nov 2014 2
- Oct 2014 4
- Sep 2014 2
- Aug 2014 1
- Jul 2014 1
- Mar 2014 3
- Feb 2014 2
- Jan 2014 2
- Nov 2013 1
- Oct 2013 1
- Sep 2013 1
- Jul 2013 3
- Apr 2013 3
- Jan 2013 3
- Dec 2012 2
- Nov 2012 3
- Oct 2012 1
- Sep 2012 3
- Aug 2012 3
- Jul 2012 2
- Jun 2012 1
- May 2012 3
- Apr 2012 2
- Mar 2012 4
- Feb 2012 4
- Jan 2012 5
- Dec 2011 4
- Nov 2011 9
- Oct 2011 10
- Sep 2011 9
- Aug 2011 6
- Jul 2011 6
- Jun 2011 12
- May 2011 8
- Apr 2011 4
- Mar 2011 5
- Jan 2011 6
- Dec 2010 9
- Nov 2010 3
- Oct 2010 4
- Sep 2010 6
- Aug 2010 8
- Jul 2010 6
- Jun 2010 3
- May 2010 3
- Apr 2010 1
- Mar 2010 3
- Feb 2010 3
- Dec 2009 1
- Jun 2009 1
- May 2009 1
- Feb 2009 1
- Dec 2008 1
- Nov 2008 1
- Jun 2008 1