
Third quarter 2015 performance
Q3 2015 summary: 38% warmer, 22% less usage and 3% more sun as compared to Q3 2014.
This is part of our quarterly home performance reporting. All data is posted at netplusdesign.com
Traditionally, 3rd quarters are pretty boring in the home performance category. No heating. Generally no air conditioning. No ventilator because the windows are open. At this time of year, the main job of the house is to keep the rain out, and we didn’t get much of that this quarter.
Our most exciting finding this quarter was that we had a 1+ megawatt month. In August we produced 1.003 MW. This is only the second time we’ve produced more than a megawatt in a single month. The first was August 2012 when we produced 1.018 MW.
Sometime in early August we became net positive for the year. We now have a surplus of 1,239 kWh heading into the final months of 2015.
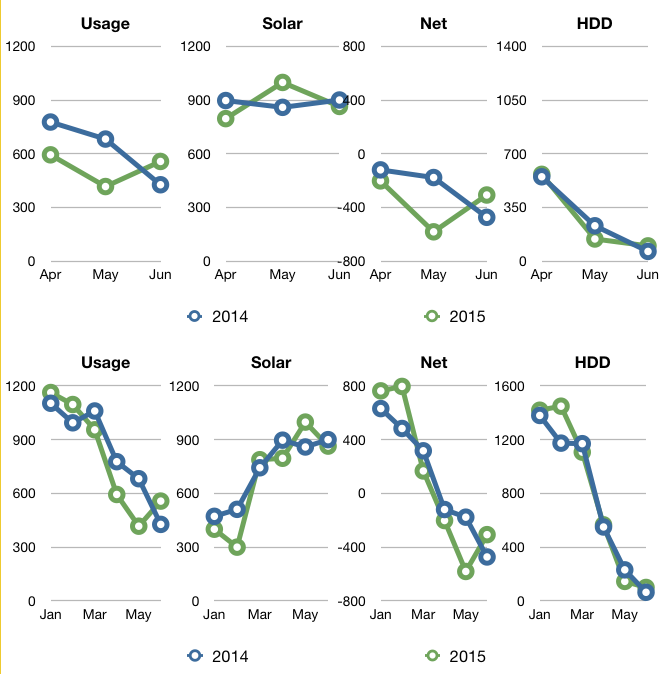
Overall, here’s how this quarter compared to 2014.
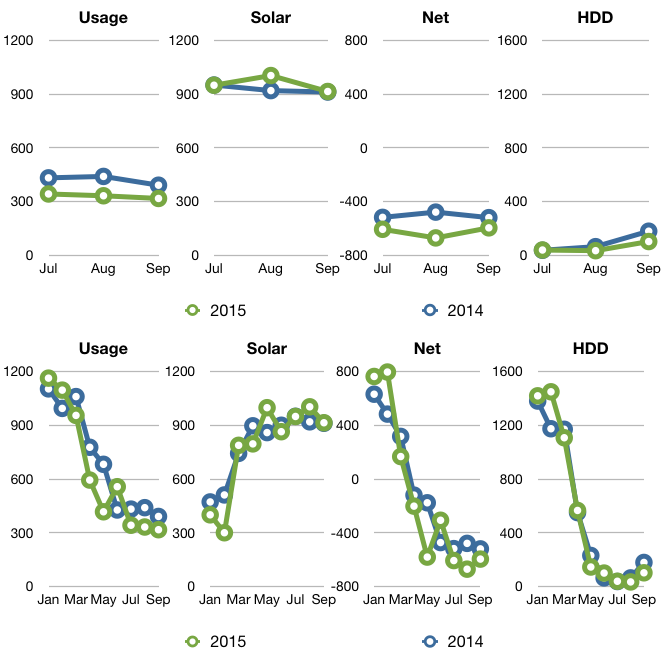
| 2014 | Usage | Solar PV | Net usage or (surplus) | Avg. daily usage | HDD |
|---|---|---|---|---|---|
| Total | 1,263 | 2,780 | (1,517) | 13.7 | 280 |
| Jul | 432 | 950 | (518) | 13.9 | 37 |
| Aug | 440 | 919 | (479) | 14.2 | 64 |
| Sep | 391 | 911 | (520) | 13.0 | 179 |
| 2015 | Usage | Solar PV | Net usage or (surplus) | Avg. daily usage | HDD |
|---|---|---|---|---|---|
| Total | 991 | 2,866 | (1,874) | 10.8 | 175 |
| Jul | 342 | 949 | (607) | 11.0 | 39 |
| Aug | 332 | 1,003 | (671) | 10.7 | 34 |
| Sep | 317 | 914 | (596) | 10.6 | 102 |
You can see heat maps and detailed charts of temperature and electrical usage at netplusdesign.com. View hourly, daily and monthly values for solar, usage, net usage, temperatures and HDD.

Categories
- Air sealing 13
- Appliances & Fixtures 4
- Art 3
- Award 4
- Bathroom 8
- Batteries 1
- Decor 5
- Design 10
- Electrical 5
- Energy Calculations 13
- Energy Monitors 4
- Farm 1
- Finance 1
- Flooring 3
- Foundation 9
- Framing 8
- Heating 9
- House 7
- Insulation 8
- Kitchen 6
- Landscaping 3
- Lessons Learned 1
- Performance 60
- Plumbing 10
- Porch 5
- Radon 1
- Rainwater catchment 3
- Research / study 1
- Roof 7
- Septic / Waste water 2
- Sheetrock 6
- Siding 9
- Site Work 22
- Smart home 1
- Solar 64
- Solar Obsessed 10
- Stairs 2
- Surveying 3
- Ventilation 8
- Weather 1
- Windows & Doors 14
- plug-in 3
Archive
- Jan 2021 1
- Dec 2020 2
- May 2020 1
- Jan 2020 1
- May 2019 1
- Jan 2019 3
- Sep 2018 2
- Aug 2018 2
- Jan 2018 1
- Oct 2017 2
- Apr 2017 1
- Jan 2017 1
- Oct 2016 2
- Aug 2016 1
- Apr 2016 2
- Jan 2016 2
- Nov 2015 2
- Oct 2015 1
- Jul 2015 1
- May 2015 1
- Apr 2015 1
- Jan 2015 1
- Dec 2014 1
- Nov 2014 2
- Oct 2014 4
- Sep 2014 2
- Aug 2014 1
- Jul 2014 1
- Mar 2014 3
- Feb 2014 2
- Jan 2014 2
- Nov 2013 1
- Oct 2013 1
- Sep 2013 1
- Jul 2013 3
- Apr 2013 3
- Jan 2013 3
- Dec 2012 2
- Nov 2012 3
- Oct 2012 1
- Sep 2012 3
- Aug 2012 3
- Jul 2012 2
- Jun 2012 1
- May 2012 3
- Apr 2012 2
- Mar 2012 4
- Feb 2012 4
- Jan 2012 5
- Dec 2011 4
- Nov 2011 9
- Oct 2011 10
- Sep 2011 9
- Aug 2011 6
- Jul 2011 6
- Jun 2011 12
- May 2011 8
- Apr 2011 4
- Mar 2011 5
- Jan 2011 6
- Dec 2010 9
- Nov 2010 3
- Oct 2010 4
- Sep 2010 6
- Aug 2010 8
- Jul 2010 6
- Jun 2010 3
- May 2010 3
- Apr 2010 1
- Mar 2010 3
- Feb 2010 3
- Dec 2009 1
- Jun 2009 1
- May 2009 1
- Feb 2009 1
- Dec 2008 1
- Nov 2008 1
- Jun 2008 1