
We're net positive again in 2016!
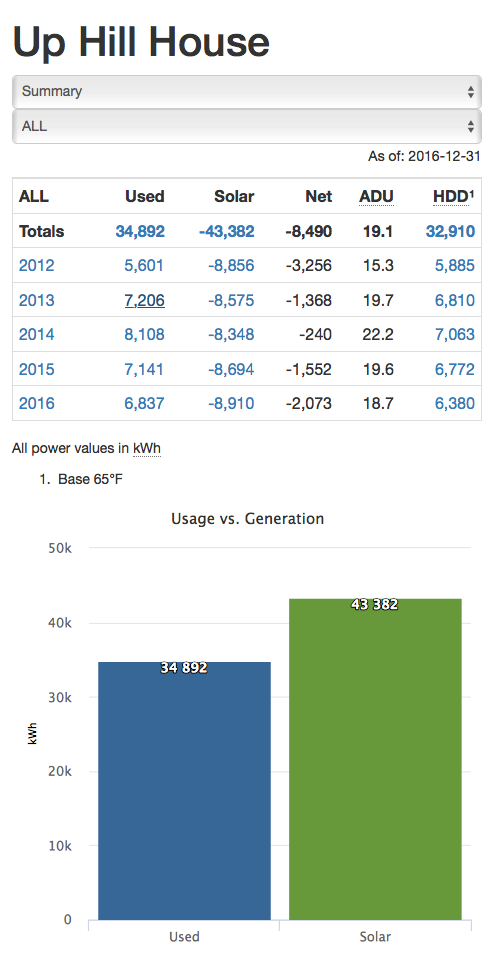
We used 6,837 kWh and generated 8,910 kWh for a net of 2,073 kWh for the year.
This is our second highest net energy surplus year after 2012 and our highest solar generation year.
Q4 2016 summary: 24% colder, 38% more usage and 17% less sun as compared to Q4 2015.
In Q4 our total usage was 1,890 kWh, a 38% increase from our 1,368 kWh in 2015. We also generated 281 kWh less solar.
Overall, here’s how this quarter and the year compare.
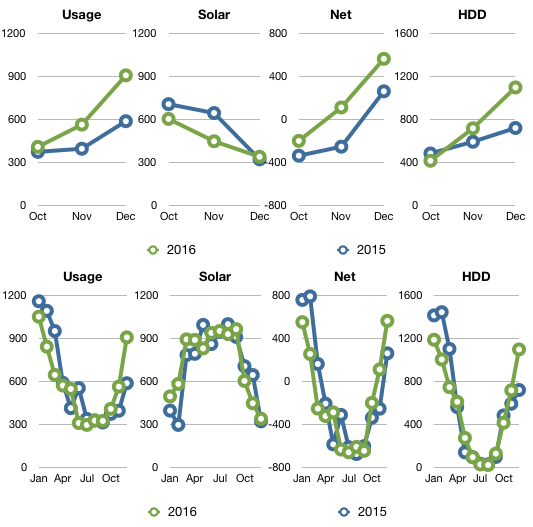
| 2015 | Usage | Solar PV | Net usage or (surplus) | Avg. daily usage | HDD |
|---|---|---|---|---|---|
| Total | 1,368 | 1,683 | (315) | 14.9 | 1,810 |
| Oct | 377 | 710 | (333) | 12.2 | 488 |
| Nov | 399 | 648 | (248) | 13.3 | 597 |
| Dec | 591 | 325 | 266 | 19.1 | 725 |
| 2016 | Usage | Solar PV | Net usage or (surplus) | Avg. daily usage | HDD |
|---|---|---|---|---|---|
| Total | 1,890 | 1,402 | 488 | 20.5 | 2,243 |
| Oct | 412 | 607 | (195) | 13.3 | 420 |
| Nov | 567 | 451 | 115 | 18.9 | 722 |
| Dec | 911 | 343 | 568 | 29.4 | 1,102 |
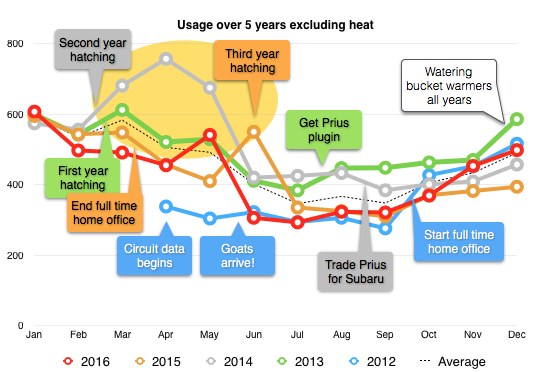
Year-over-year comparison
Here’s our progress for the first 5 years in the house.
| Usage | Solar PV | Net usage or (surplus) | Avg. daily usage | HDD | |
|---|---|---|---|---|---|
| Total | 34,892 | 43,382 | (8,490) | 19.1 | 32,910 |
| 2012 | 5,601 | 8,856 | (3,256) | 15.3 | 5,885 |
| 2013 | 7,206 | 8,575 | (1,368) | 19.7 | 6,810 |
| 2014 | 8,108 | 8,348 | (240) | 22.2 | 7,063 |
| 2015 | 7,141 | 8,694 | (1,552) | 19.6 | 6,772 |
| 2016 | 6,837 | 8,910 | (2,073) | 18.7 | 6,380 |
Circuit-by-circuit
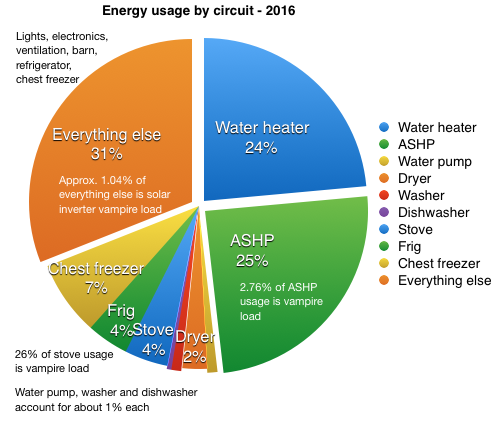
I broke out a few additional circuits worthy of note, the refrigerator (4%) and chest freezer (7%), removing them from the ‘everything else’ category. 2016 was our second warmest year in the house, although we continue to see wide extremes in temperature ranges (see temperature ranges below). As a result, the ASHP used a smaller percentage of the total. Vampire loads increased this year. Seems to be the nature of vampires, they such you dry without vigilant attention. We appear to have cooked less in 2016 as the induction cooktop & stove vampire loads increased in comparison to use. The combined vampire load for the stove, ASHP and solar inverter was 145 kWh in 2016 (same as 2015).
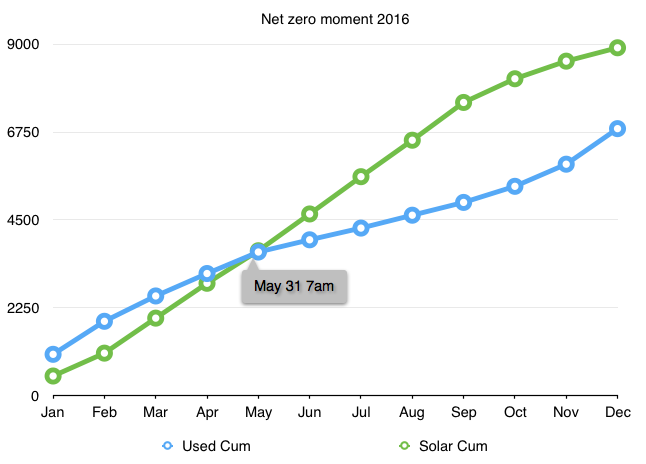
Net-zero moment
Our ‘net zero moment’ this year occurred on May 31 at 7am. This was our second earliest time since 2012. Our solar curve remains fairly constant. Our usage changes the most from year to year, manly due to weather.
Where did all that solar go?
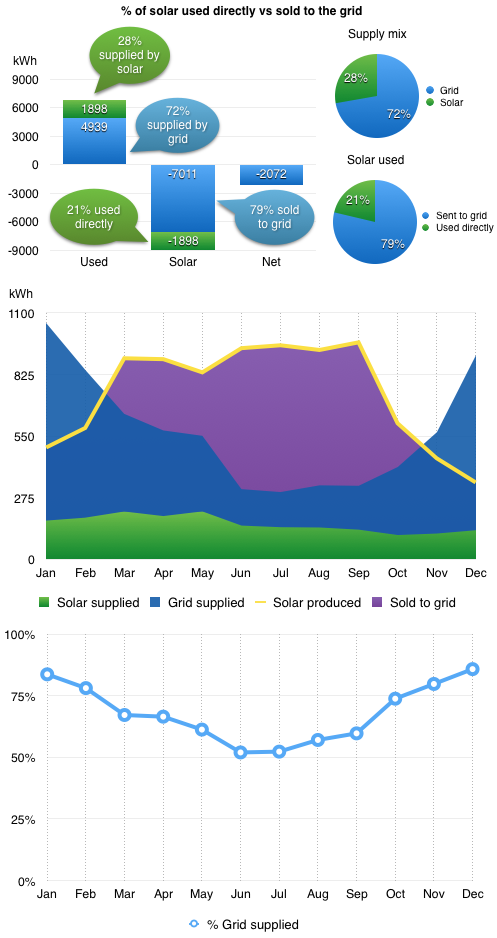
28% of our power needs were supplied by our own solar generation directly. The other 72% was supplied from the grid. Of the 8.910 kWh we generated in 2016, we only used used 21% directly. The other 79% we sold back to the grid (at a greatly reduced price) so other people use it (if there was demand for it).
This make 5 full years not having to pay for electricity. We still pay the monthly connection fee, minus any rebate from the utility for excess electricity generated. This year we earned $73.62, or 0.355 cents per kWh. We won’t be quoting our day jobs any time soon.
National Grid does not tell us how much electricity would cost if we bought it from them. They only do that if you actually use more electricity than you generate. So I have to go to the NYSEDA website to find the state averages. Using their data, we would have paid about $6,500 over the past 5 years for the 34,892 kWh we’ve used if we didn’t have solar. Our solar cost $14,320 in 2011. In very simple terms that puts us at about 45% payback.
Air-source Heat Pump performance
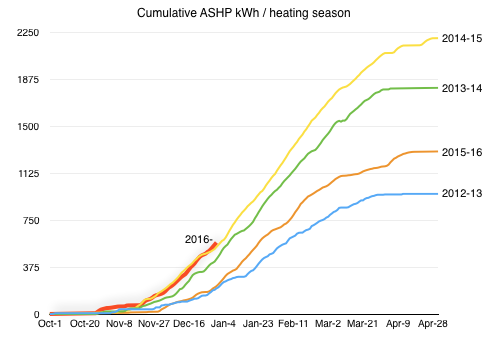
This was the second coldest fourth quarter since we moved into the house. As a result, we used a more heating energy than the last two years. We’re currently on course with the coldest season 2014 as seen in the chart above. Overall, heating season 2015-2016 worked out to be our second highest energy use in the last 5 years. We used just over 1,297 kWh for heat. At $0.17/kWh that would be about $220.
My thermostat strategy this year is to mostly just leave it at 68 degrees F. As the charts show below, leaving it at 68 every day incurred more vampire losses, but overall the energy use is not greater. Cleaning the filters every month also has a noticeable impact.
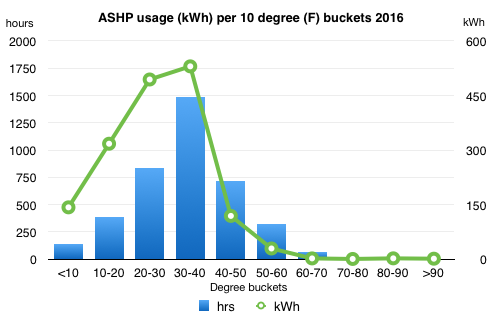
Something that is quite different than previous years, the temperature bucket for 30-40 degrees F was off the chart this year. Literally, I had to change the range in the chart! Our last highest number of hours in this range was 935 hours in 2014. This year we had 1,484 hours in this temperature range, almost double the average. Although 2016 saw the ASHP working the largest number of hours, it’s total usage was only the second largest since we started tracking circuit-level data.
The lesson I’m learning from this data is that I should just leave the thermostat at 68. Set and forget. Fiddling with the thermostat settings does not appear to decrease our energy usage.
Water
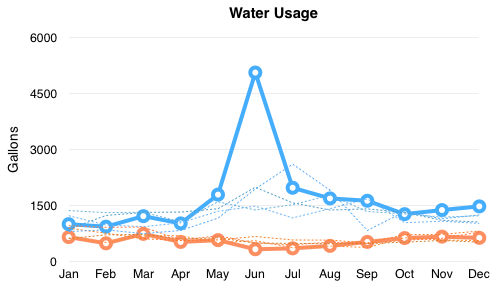
We have been fairly consistent in our hot water usage. Over the year we averaged 17.5 gallons/day, same as last year. That hot water requires 251 watts/gallon to heat. But our cold water usage is a different story. As you can see from the chart above, we used a rather large amount of water in June. At first I thought perhaps we left the water on overnight. But no, it appears we watered the garden a lot in June. We used a total 26,735 gallons of water in 2016, 73 gal/day, as compared to 20,684 gallons in 2015, up 6,051 gallons, a 29% increase. It took 69 kWh to pump that water out of the ground.
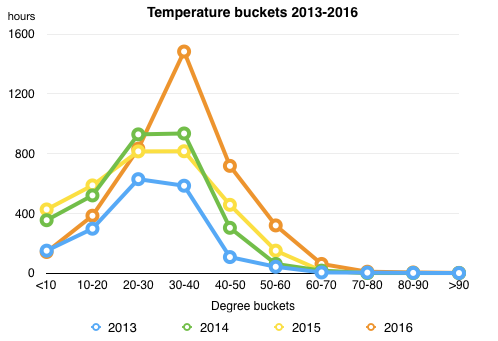
Temperature
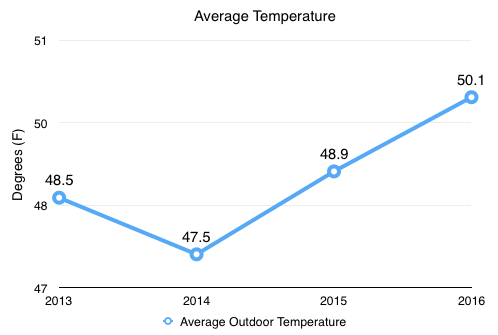
We experienced our largest temperature range this year out of the last 5 years, 111°. Our coldest temperature was -17.3° on February 14 at 7am. Our high was 93.7° on July 7 at 12pm. Our highest recorded temperature in the last four years was 95.135°, set on July 19, 2013 at 3pm.
The average temperature for 2016 was 50.1°, 1.2° up from 48.9° in 2015.
New App
I recently rewrote the data viewing app to make it easier to drill down from years, to months, days and hours, and back up again. It’s now easier to switch between years, circuits and temperature locations. Check it out at Netplusdesign.
Another new app
Every winter I pick a new tool or technology to learn. This year it was Electron. I built a desktop app to help publish my quarterly data. If you’re into code, you can check that out on Github.
May your 2017 be better than 2016!

Categories
- Air sealing 13
- Appliances & Fixtures 4
- Art 3
- Award 4
- Bathroom 8
- Batteries 1
- Decor 5
- Design 10
- Electrical 5
- Energy Calculations 13
- Energy Monitors 4
- Farm 1
- Finance 1
- Flooring 3
- Foundation 9
- Framing 8
- Heating 9
- House 7
- Insulation 8
- Kitchen 6
- Landscaping 3
- Lessons Learned 1
- Performance 60
- Plumbing 10
- Porch 5
- Radon 1
- Rainwater catchment 3
- Research / study 1
- Roof 7
- Septic / Waste water 2
- Sheetrock 6
- Siding 9
- Site Work 22
- Smart home 1
- Solar 64
- Solar Obsessed 10
- Stairs 2
- Surveying 3
- Ventilation 8
- Weather 1
- Windows & Doors 14
- plug-in 3
Archive
- Jan 2021 1
- Dec 2020 2
- May 2020 1
- Jan 2020 1
- May 2019 1
- Jan 2019 3
- Sep 2018 2
- Aug 2018 2
- Jan 2018 1
- Oct 2017 2
- Apr 2017 1
- Jan 2017 1
- Oct 2016 2
- Aug 2016 1
- Apr 2016 2
- Jan 2016 2
- Nov 2015 2
- Oct 2015 1
- Jul 2015 1
- May 2015 1
- Apr 2015 1
- Jan 2015 1
- Dec 2014 1
- Nov 2014 2
- Oct 2014 4
- Sep 2014 2
- Aug 2014 1
- Jul 2014 1
- Mar 2014 3
- Feb 2014 2
- Jan 2014 2
- Nov 2013 1
- Oct 2013 1
- Sep 2013 1
- Jul 2013 3
- Apr 2013 3
- Jan 2013 3
- Dec 2012 2
- Nov 2012 3
- Oct 2012 1
- Sep 2012 3
- Aug 2012 3
- Jul 2012 2
- Jun 2012 1
- May 2012 3
- Apr 2012 2
- Mar 2012 4
- Feb 2012 4
- Jan 2012 5
- Dec 2011 4
- Nov 2011 9
- Oct 2011 10
- Sep 2011 9
- Aug 2011 6
- Jul 2011 6
- Jun 2011 12
- May 2011 8
- Apr 2011 4
- Mar 2011 5
- Jan 2011 6
- Dec 2010 9
- Nov 2010 3
- Oct 2010 4
- Sep 2010 6
- Aug 2010 8
- Jul 2010 6
- Jun 2010 3
- May 2010 3
- Apr 2010 1
- Mar 2010 3
- Feb 2010 3
- Dec 2009 1
- Jun 2009 1
- May 2009 1
- Feb 2009 1
- Dec 2008 1
- Nov 2008 1
- Jun 2008 1