
First quarter 2017 performance
Q1 2017 summary: 3% colder, 6% more usage and 20% less sun as compared to Q1 2016.
I’ll say it, it was a whacky winter. Lots of cold days, but also lots of warm days. It would be warm for a week or two, the ground would thaw, then we’d get snow.
We recorded a low of 3.3, quite a bit warmer than the -17.3°F last year’s low. Our high was 73.6, less than the 78.5°F last year. In 2012 we recorded a high of 82.4°F in the same period.
Overall, here’s how this quarter compared to 2016.

| 2016 | Usage | Solar PV | Net usage or (surplus) | Avg. daily usage | HDD |
|---|---|---|---|---|---|
| Total | 2,550 | 1,982 | 568 | 28.0 | 2,952 |
| Jan | 1,055 | 499 | 556 | 34.0 | 1,192 |
| Feb | 846 | 586 | 260 | 29.2 | 1,009 |
| Mar | 649 | 897 | (248) | 20.9 | 751 |
| 2017 | Usage | Solar PV | Net usage or (surplus) | Avg. daily usage | HDD |
|---|---|---|---|---|---|
| Total | 2,709 | 1,586 | 1,122 | 30.1 | 3,054 |
| Jan | 1,035 | 357 | 678 | 33.4 | 1,085 |
| Feb | 783 | 478 | 305 | 28.0 | 890 |
| Mar | 891 | 752 | 140 | 28.8 | 1,079 |
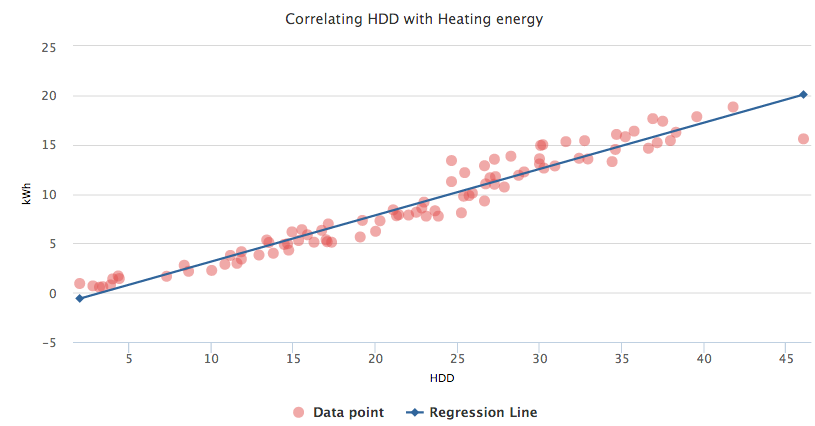
Our heat pump used 955 kWh last year and 1,195 kWh this year. Thats about $180 in electricity. We’re getting a fairly consistent correlation between energy use and heating degree days using a base temperature of 65°F.
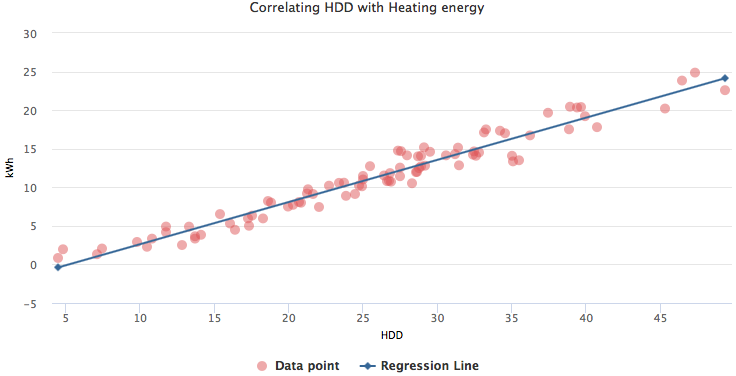
The higher energy use was directly correlated to colder temperatures. Plus there was more snow to hide the solar panels and it was more cloudy, so we generated less energy as well.
Last year the grass was just starting to green up and we had a few plants budding out. A few trees looked like they were ready to pop. Not this year. April 1 we got about an inch of ice/snow and it still looks like Winter out there. As always about this time of year, we are most definitely ready for Spring!

Categories
- Air sealing 13
- Appliances & Fixtures 4
- Art 3
- Award 4
- Bathroom 8
- Batteries 1
- Decor 5
- Design 10
- Electrical 5
- Energy Calculations 13
- Energy Monitors 4
- Farm 1
- Finance 1
- Flooring 3
- Foundation 9
- Framing 8
- Heating 9
- House 7
- Insulation 8
- Kitchen 6
- Landscaping 3
- Lessons Learned 1
- Performance 60
- Plumbing 10
- Porch 5
- Radon 1
- Rainwater catchment 3
- Research / study 1
- Roof 7
- Septic / Waste water 2
- Sheetrock 6
- Siding 9
- Site Work 22
- Smart home 1
- Solar 64
- Solar Obsessed 10
- Stairs 2
- Surveying 3
- Ventilation 8
- Weather 1
- Windows & Doors 14
- plug-in 3
Archive
- Jan 2021 1
- Dec 2020 2
- May 2020 1
- Jan 2020 1
- May 2019 1
- Jan 2019 3
- Sep 2018 2
- Aug 2018 2
- Jan 2018 1
- Oct 2017 2
- Apr 2017 1
- Jan 2017 1
- Oct 2016 2
- Aug 2016 1
- Apr 2016 2
- Jan 2016 2
- Nov 2015 2
- Oct 2015 1
- Jul 2015 1
- May 2015 1
- Apr 2015 1
- Jan 2015 1
- Dec 2014 1
- Nov 2014 2
- Oct 2014 4
- Sep 2014 2
- Aug 2014 1
- Jul 2014 1
- Mar 2014 3
- Feb 2014 2
- Jan 2014 2
- Nov 2013 1
- Oct 2013 1
- Sep 2013 1
- Jul 2013 3
- Apr 2013 3
- Jan 2013 3
- Dec 2012 2
- Nov 2012 3
- Oct 2012 1
- Sep 2012 3
- Aug 2012 3
- Jul 2012 2
- Jun 2012 1
- May 2012 3
- Apr 2012 2
- Mar 2012 4
- Feb 2012 4
- Jan 2012 5
- Dec 2011 4
- Nov 2011 9
- Oct 2011 10
- Sep 2011 9
- Aug 2011 6
- Jul 2011 6
- Jun 2011 12
- May 2011 8
- Apr 2011 4
- Mar 2011 5
- Jan 2011 6
- Dec 2010 9
- Nov 2010 3
- Oct 2010 4
- Sep 2010 6
- Aug 2010 8
- Jul 2010 6
- Jun 2010 3
- May 2010 3
- Apr 2010 1
- Mar 2010 3
- Feb 2010 3
- Dec 2009 1
- Jun 2009 1
- May 2009 1
- Feb 2009 1
- Dec 2008 1
- Nov 2008 1
- Jun 2008 1