
We're net positive again in 2017!
We used 7,198 kWh and generated 7,966 kWh for a net of 769 kWh for the year.
2016 was our second highest net energy surplus year after 2012 and our highest solar generation year.
2017 was our second lowest net energy surplus year after 2014 and our lowest solar generation year over the last 6 years. We had a lot of cloudy days and snow covered panels.
Q4 2017 summary: 2% colder, 7% more usage and 5% more sun as compared to Q4 2016.
In Q4 our total usage was 2,022 kWh, a 7% increase from our 1,890 kWh in 2016. We also generated 65 kWh more solar.
Overall, here’s how this quarter and the year compare.
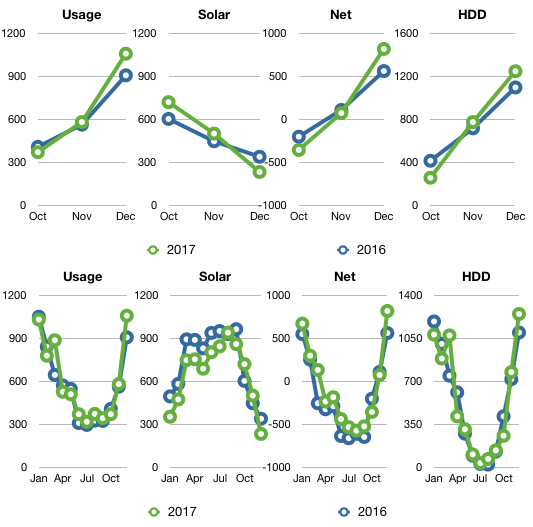
| 2016 | Usage | Solar PV | Net usage or (surplus) | Avg. daily usage | HDD |
|---|---|---|---|---|---|
| Total | 1,890 | 1,402 | 488 | 20.5 | 2,243 |
| Oct | 412 | 607 | (195) | 13.3 | 420 |
| Nov | 567 | 451 | 115 | 18.9 | 722 |
| Dec | 911 | 343 | 568 | 29.4 | 1,102 |
| 2017 | Usage | Solar PV | Net usage or (surplus) | Avg. daily usage | HDD |
|---|---|---|---|---|---|
| Total | 2,022 | 1,466 | 556 | 21.9 | 2,295 |
| Oct | 375 | 724 | (349) | 12.1 | 262 |
| Nov | 585 | 505 | 80 | 19.5 | 780 |
| Dec | 1,062 | 237 | 825 | 34.2 | 1,253 |
Year-over-year comparison
Here’s our progress for the first 5 years in the house.
| Usage | Solar PV | Net usage or (surplus) | Avg. daily usage | HDD | |
|---|---|---|---|---|---|
| Total | 42,091 | 51,348 | (9,258) | 19.2 | 39,363 |
| 2012 | 5,601 | 8,856 | (3,256) | 15.3 | 5,885 |
| 2013 | 7,206 | 8,575 | (1,368) | 19.7 | 6,810 |
| 2014 | 8,108 | 8,348 | (240) | 22.2 | 7,063 |
| 2015 | 7,141 | 8,694 | (1,552) | 19.6 | 6,772 |
| 2016 | 6,837 | 8,910 | (2,073) | 18.7 | 6,380 |
| 2017 | 7,198 | 7,966 | (769) | 19.7 | 6,452 |
Circuit-by-circuit
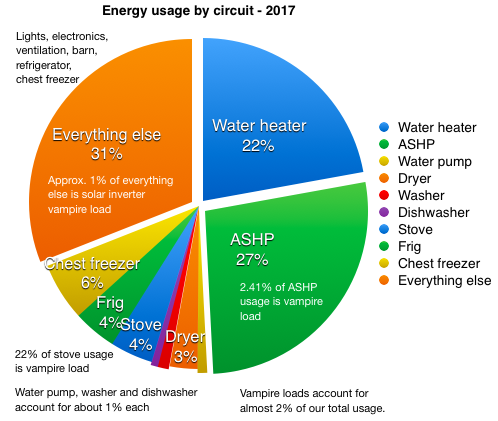
2017 was our third warmest year in the house, although we continue to see wide extremes in temperature ranges (see temperature ranges below). The ASHP used 27% of the total as opposed to 25% last year. Vampire loads decreased slightly this year. We again appear to have cooked less in 2017 as the induction cooktop & stove vampire loads increased in comparison to use. The combined vampire load for the stove, ASHP and solar inverter was 137 kWh in 2017, about 8 kWh less than last year.
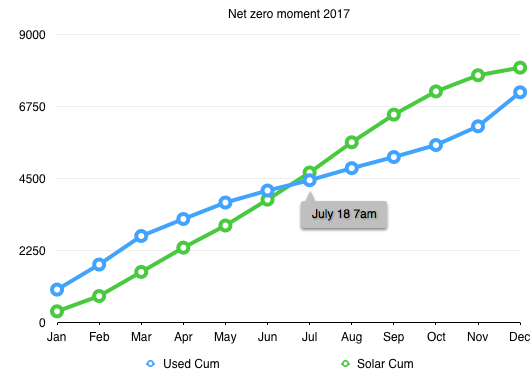
Net-zero moment
Our ‘net zero moment’ this year occurred on July 18 at 7am. This was our third earliest time since 2012. Our solar curve remains fairly constant. Our usage changes the most from year to year, manly due to weather. We had 23 days in 2017 where the solar panels generated less than 1 kW, mainly because they were covered in snow. We had only 13 days such days in 2016.
Where did all that solar go?
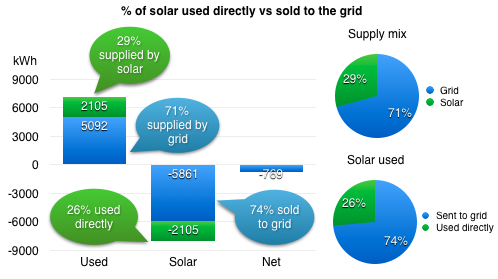
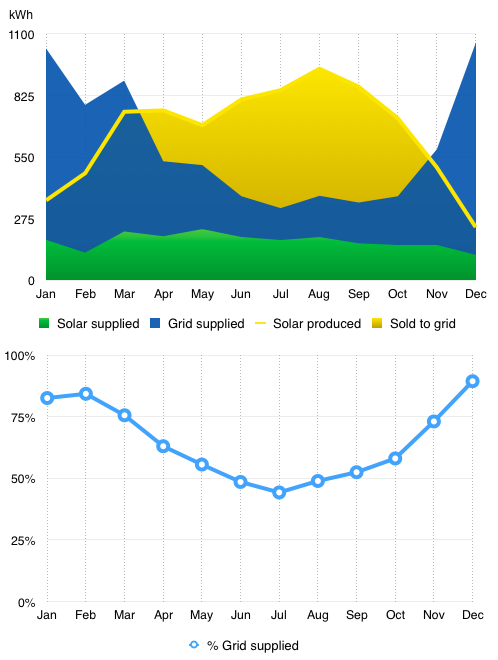
I still find it amazing that although we generate more energy than we consume each year, we directly consume only 1/3 of it, the rest is fed back to the grid. That means over 2/3 of the energy we use is still supplied by the grid. We would need battery storage to make use of a greater percentage, thereby lowering our demand on the grid.
In 2017, 29% of our power needs were supplied by our own solar generation directly. The other 71% was supplied from the grid. Of the 7,966 kWh we generated in 2017, we only used used 26% directly. The other 74% we sold back to the grid (at a greatly reduced price) so other people use it (if there was demand for it).
This make 6 full years not having to pay for electricity. We still pay the monthly connection fee, minus any rebate from the utility for excess electricity generated. This year we earned $45.35 or 0.0355 cents per kWh. That’s $28.27 less than 2016.
National Grid does not tell us how much electricity would cost if we bought it from them. They only do that if you actually use more electricity than you generate. So I have to go to the NYSEDA website to find the state averages. Using their data, we would have paid about $7,781 over the past 6 years for the 42,090 kWh we’ve used if we didn’t have solar. Our solar cost $14,320 to purchase in 2011. In very simple terms that puts us at about 54% payback. At our current rate of use and the trending price of power, it will take us another 5-6 years to break even in simple terms.
Air-source Heat Pump performance
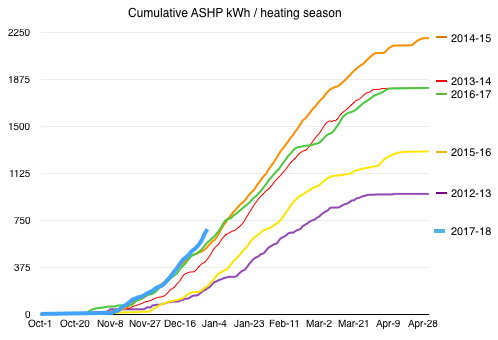
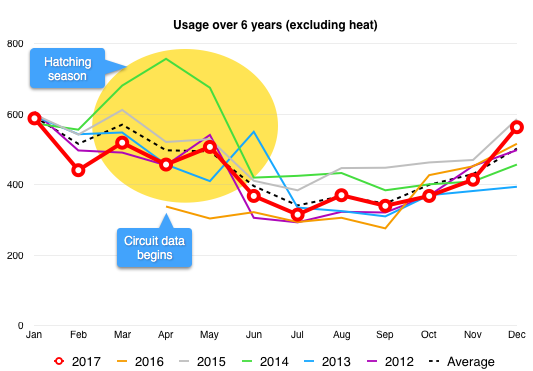
This was the third warmest fourth quarter since we moved into the house. We started off on a steep curve in 2017 but decreased our slope in January and February. We ended up using about the same heating energy as 2013-2014. We’re currently charting above the 2017 level as seen above. Overall, heating season 2016-2017 worked out to be our second highest energy use in the last 6 years. We used just over 1,946 kWh for heat in 2017. At the average electricity price this year, $0.18/kWh, that would be about $350. That is 6,452 HDD for $350. That is about $0.05/HDD.
My thermostat strategy this year is to just leave it at 68 degrees F. As the charts show below, leaving it at 68 every day incurred more vampire losses, but overall the energy use is not greater. Cleaning the filters every month also has a noticeable impact.
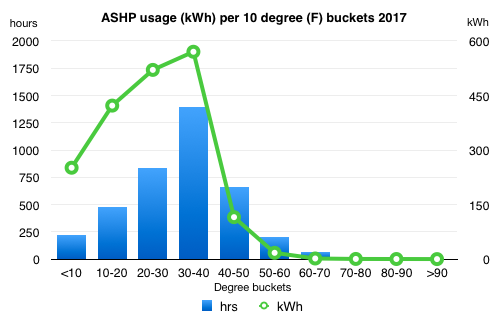
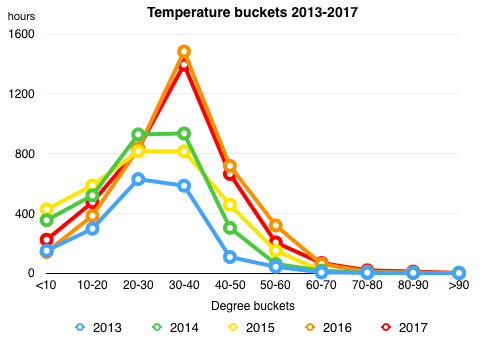
Similar to last year we saw a larger number of 30-40 degrees F days. The graph is almost identical to 2016 although we had more cold hours in the lower temperature ranges. Our last highest number of hours in the 30-40 degree range was 935 hours in 2014. This year we had 1,484 hours in this temperature range, only 88 hours lees than 2016. The ASHP ran 63 hours less than 2016 but used the second largest number of hours, it’s total usage was the second largest since we started tracking circuit-level data.
Water
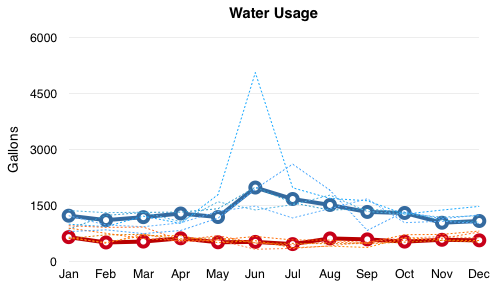
We have been fairly consistent in our hot water usage. Over the year we averaged 18.1, almost the same as last year. That hot water requires 242 watts/gallon to heat. We fared much better in out cold water usage in 2017 as opposed to last year’s spike. We used a total 22,406 gallons of water in 2017, 61.4 gal/day, as compared to 26,735 gallons of water in 2016, 73 gal/day, and 20,684 gallons in 2015. Oddly, it took the same 69 kWh to pump that water out of the ground, same as last year. Our water pump used about 3.1 Wh/gal this year versus 2.6 Wh/gal last year. Will have to keep an eye on the pump.
Temperature
](/assets/img/2017/01/temperature-ranges-20162.png)
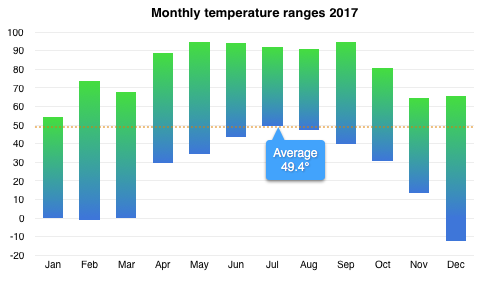
We experienced our 3rd largest largest temperature range this year out of the last 6 years, 108°. Our coldest temperature was -13.2° on December 28 at 7am. Our high was 94.8° on May 18 at 1pm. Our highest recorded temperature in the last four years was 95.135°, set on July 19, 2013 at 3pm.
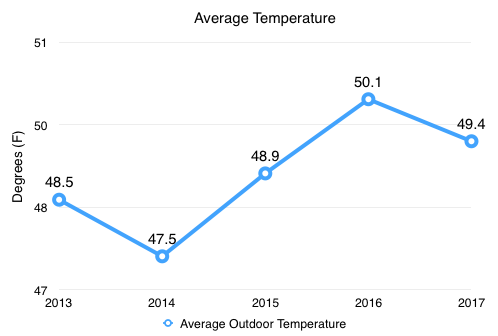
The average temperature for 2016 was 49.4°, 0.7° down from 50.1° in 2016.
Happy 2018 all.

Categories
- Air sealing 13
- Appliances & Fixtures 4
- Art 3
- Award 4
- Bathroom 8
- Batteries 1
- Decor 5
- Design 10
- Electrical 5
- Energy Calculations 13
- Energy Monitors 4
- Farm 1
- Finance 1
- Flooring 3
- Foundation 9
- Framing 8
- Heating 9
- House 7
- Insulation 8
- Kitchen 6
- Landscaping 3
- Lessons Learned 1
- Performance 60
- Plumbing 10
- Porch 5
- Radon 1
- Rainwater catchment 3
- Research / study 1
- Roof 7
- Septic / Waste water 2
- Sheetrock 6
- Siding 9
- Site Work 22
- Smart home 1
- Solar 64
- Solar Obsessed 10
- Stairs 2
- Surveying 3
- Ventilation 8
- Weather 1
- Windows & Doors 14
- plug-in 3
Archive
- Jan 2021 1
- Dec 2020 2
- May 2020 1
- Jan 2020 1
- May 2019 1
- Jan 2019 3
- Sep 2018 2
- Aug 2018 2
- Jan 2018 1
- Oct 2017 2
- Apr 2017 1
- Jan 2017 1
- Oct 2016 2
- Aug 2016 1
- Apr 2016 2
- Jan 2016 2
- Nov 2015 2
- Oct 2015 1
- Jul 2015 1
- May 2015 1
- Apr 2015 1
- Jan 2015 1
- Dec 2014 1
- Nov 2014 2
- Oct 2014 4
- Sep 2014 2
- Aug 2014 1
- Jul 2014 1
- Mar 2014 3
- Feb 2014 2
- Jan 2014 2
- Nov 2013 1
- Oct 2013 1
- Sep 2013 1
- Jul 2013 3
- Apr 2013 3
- Jan 2013 3
- Dec 2012 2
- Nov 2012 3
- Oct 2012 1
- Sep 2012 3
- Aug 2012 3
- Jul 2012 2
- Jun 2012 1
- May 2012 3
- Apr 2012 2
- Mar 2012 4
- Feb 2012 4
- Jan 2012 5
- Dec 2011 4
- Nov 2011 9
- Oct 2011 10
- Sep 2011 9
- Aug 2011 6
- Jul 2011 6
- Jun 2011 12
- May 2011 8
- Apr 2011 4
- Mar 2011 5
- Jan 2011 6
- Dec 2010 9
- Nov 2010 3
- Oct 2010 4
- Sep 2010 6
- Aug 2010 8
- Jul 2010 6
- Jun 2010 3
- May 2010 3
- Apr 2010 1
- Mar 2010 3
- Feb 2010 3
- Dec 2009 1
- Jun 2009 1
- May 2009 1
- Feb 2009 1
- Dec 2008 1
- Nov 2008 1
- Jun 2008 1