
First quarter 2018 performance
Q1 2018 summary: 4% colder, 3% less usage and 13% less sun as compared to Q1 2017.
This is part of our quarterly home performance reporting. All data is posted at netplusdesign.com
I said it last year and I’ll say it again, it was a whacky winter. Lots of cold days, but also lots of warm days. It would be warm for a week or two, the ground would thaw, then we’d get snow.
We recorded a low of -17.1 on January 7, close to our lowest recorded temperature of -17.3°F on February 14, 2016. Our high was 77.6, higher than the 73.6°F last year. In 2012 we recorded a high of 82.4°F in the same period.
Overall, here’s how this quarter compared to 2017.
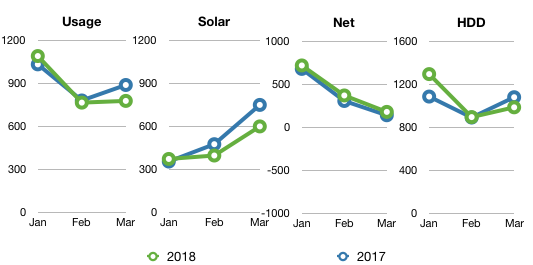
| 2017 | Usage | Solar PV | Net usage or (surplus) | Avg. daily usage | HDD |
|---|---|---|---|---|---|
| Total | 2,710 | 1,586 | 1,123 | 30.1 | 3,056 |
| Jan | 1,035 | 357 | 678 | 33.4 | 1,086 |
| Feb | 783 | 478 | 305 | 28.0 | 890 |
| Mar | 892 | 752 | 141 | 28.8 | 1,079 |
| 2018 | Usage | Solar PV | Net usage or (surplus) | Avg. daily usage | HDD |
|---|---|---|---|---|---|
| Total | 2,640 | 1,375 | 1,265 | 29.3 | 3,173 |
| Jan | 1,093 | 375 | 718 | 35.3 | 1,294 |
| Feb | 768 | 399 | 368 | 27.4 | 894 |
| Mar | 780 | 602 | 178 | 25.2 | 985 |
You can see heat maps and detailed charts of temperature and electrical usage at netplusdesign.com. View hourly, daily and monthly values for solar, usage, net usage, temperatures and HDD.

Categories
- Air sealing 13
- Appliances & Fixtures 4
- Art 3
- Award 4
- Bathroom 8
- Batteries 1
- Decor 5
- Design 10
- Electrical 5
- Energy Calculations 13
- Energy Monitors 4
- Farm 1
- Finance 1
- Flooring 3
- Foundation 9
- Framing 8
- Heating 9
- House 7
- Insulation 8
- Kitchen 6
- Landscaping 3
- Lessons Learned 1
- Performance 60
- Plumbing 10
- Porch 5
- Radon 1
- Rainwater catchment 3
- Research / study 1
- Roof 7
- Septic / Waste water 2
- Sheetrock 6
- Siding 9
- Site Work 22
- Smart home 1
- Solar 64
- Solar Obsessed 10
- Stairs 2
- Surveying 3
- Ventilation 8
- Weather 1
- Windows & Doors 14
- plug-in 3
Archive
- Jan 2021 1
- Dec 2020 2
- May 2020 1
- Jan 2020 1
- May 2019 1
- Jan 2019 3
- Sep 2018 2
- Aug 2018 2
- Jan 2018 1
- Oct 2017 2
- Apr 2017 1
- Jan 2017 1
- Oct 2016 2
- Aug 2016 1
- Apr 2016 2
- Jan 2016 2
- Nov 2015 2
- Oct 2015 1
- Jul 2015 1
- May 2015 1
- Apr 2015 1
- Jan 2015 1
- Dec 2014 1
- Nov 2014 2
- Oct 2014 4
- Sep 2014 2
- Aug 2014 1
- Jul 2014 1
- Mar 2014 3
- Feb 2014 2
- Jan 2014 2
- Nov 2013 1
- Oct 2013 1
- Sep 2013 1
- Jul 2013 3
- Apr 2013 3
- Jan 2013 3
- Dec 2012 2
- Nov 2012 3
- Oct 2012 1
- Sep 2012 3
- Aug 2012 3
- Jul 2012 2
- Jun 2012 1
- May 2012 3
- Apr 2012 2
- Mar 2012 4
- Feb 2012 4
- Jan 2012 5
- Dec 2011 4
- Nov 2011 9
- Oct 2011 10
- Sep 2011 9
- Aug 2011 6
- Jul 2011 6
- Jun 2011 12
- May 2011 8
- Apr 2011 4
- Mar 2011 5
- Jan 2011 6
- Dec 2010 9
- Nov 2010 3
- Oct 2010 4
- Sep 2010 6
- Aug 2010 8
- Jul 2010 6
- Jun 2010 3
- May 2010 3
- Apr 2010 1
- Mar 2010 3
- Feb 2010 3
- Dec 2009 1
- Jun 2009 1
- May 2009 1
- Feb 2009 1
- Dec 2008 1
- Nov 2008 1
- Jun 2008 1