
Estimating heat energy for 2012 - Revised
Now that we have January - March 2013 circuit-level usage values, I thought I’d go back and revisit my original 2012 heat estimate using a different method.
I had estimated January - March 2012 heat energy based on a linear regression analysis of our April - December heat values. There are a number of problems with this approach. Mainly that heat pumps use more energy the colder it gets outside, and secondly the amount of passive heat we gain from the sun can significantly reduce the amount of energy required for heat.
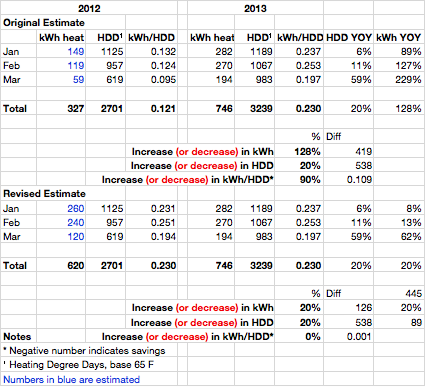
This time I used a less formulaic approach to estimate heat energy usage. I simply calculated the kWh/HDD per month for 2012 and 2013, and compared the values.
First lets look at the first 3 months of 2013. We recorded 3,239 HDD, a 20% increase from 2012 to 2013. We used 746 kWh for those 3 months. If we divide 746 kWh by 3,239 HDD we get 0.230 kWh per HDD.
Now let’s try the same for the first 3 months of 2012. We recorded 2,107 HDD and I estimated 327 kWh for heat energy. 327 / 2,107 = 0.121 kWh per HDD. That is a 128% difference from 2013. Something is clearly off.
Since 2013 was colder and less sunny, I would expect our 2013 efficiency to be less because heat pumps become less efficient at lower temperatures. So I manually adjusted the 2012 kWh values so that the kWh/HDD percentage was similar to the 2013 values, then I lowered it a bit to take into account the warmer temperatures and increase sun in 2012. Did I mention this wasn’t very scientific?
What we get is closer to 620 kWh for heat energy for the first 3 months of 2012. This is roughly a 90% increase from my earlier estimate. It also means that a 20% increase in colder weather roughly equals 20% more heat energy usage.
Looking at Q1 performance again, that means out of the 445 kWh increase in 2013, 65% of that increase was due to heat energy, 33% was water heating and everything else was 2%. That sounds a little more realistic.

Categories
- Air sealing 13
- Appliances & Fixtures 4
- Art 3
- Award 4
- Bathroom 8
- Batteries 1
- Decor 5
- Design 10
- Electrical 5
- Energy Calculations 13
- Energy Monitors 4
- Farm 1
- Finance 1
- Flooring 3
- Foundation 9
- Framing 8
- Heating 9
- House 7
- Insulation 8
- Kitchen 6
- Landscaping 3
- Lessons Learned 1
- Performance 60
- Plumbing 10
- Porch 5
- Radon 1
- Rainwater catchment 3
- Research / study 1
- Roof 7
- Septic / Waste water 2
- Sheetrock 6
- Siding 9
- Site Work 22
- Smart home 1
- Solar 64
- Solar Obsessed 10
- Stairs 2
- Surveying 3
- Ventilation 8
- Weather 1
- Windows & Doors 14
- plug-in 3
Archive
- Jan 2021 1
- Dec 2020 2
- May 2020 1
- Jan 2020 1
- May 2019 1
- Jan 2019 3
- Sep 2018 2
- Aug 2018 2
- Jan 2018 1
- Oct 2017 2
- Apr 2017 1
- Jan 2017 1
- Oct 2016 2
- Aug 2016 1
- Apr 2016 2
- Jan 2016 2
- Nov 2015 2
- Oct 2015 1
- Jul 2015 1
- May 2015 1
- Apr 2015 1
- Jan 2015 1
- Dec 2014 1
- Nov 2014 2
- Oct 2014 4
- Sep 2014 2
- Aug 2014 1
- Jul 2014 1
- Mar 2014 3
- Feb 2014 2
- Jan 2014 2
- Nov 2013 1
- Oct 2013 1
- Sep 2013 1
- Jul 2013 3
- Apr 2013 3
- Jan 2013 3
- Dec 2012 2
- Nov 2012 3
- Oct 2012 1
- Sep 2012 3
- Aug 2012 3
- Jul 2012 2
- Jun 2012 1
- May 2012 3
- Apr 2012 2
- Mar 2012 4
- Feb 2012 4
- Jan 2012 5
- Dec 2011 4
- Nov 2011 9
- Oct 2011 10
- Sep 2011 9
- Aug 2011 6
- Jul 2011 6
- Jun 2011 12
- May 2011 8
- Apr 2011 4
- Mar 2011 5
- Jan 2011 6
- Dec 2010 9
- Nov 2010 3
- Oct 2010 4
- Sep 2010 6
- Aug 2010 8
- Jul 2010 6
- Jun 2010 3
- May 2010 3
- Apr 2010 1
- Mar 2010 3
- Feb 2010 3
- Dec 2009 1
- Jun 2009 1
- May 2009 1
- Feb 2009 1
- Dec 2008 1
- Nov 2008 1
- Jun 2008 1