
First quarter 2013 performance
Q1 2013 summary: 20% more cold, 22% more usage and 15% less sun.
See April 7 Update at end of post.
In Q1 last year our net usage was 228 kWh. This year is was 953 kWh, a 300% increase! In March 2012 we actually generated a surplus, but not this year.
Overall, here’s how the first quarter compares to 2012.
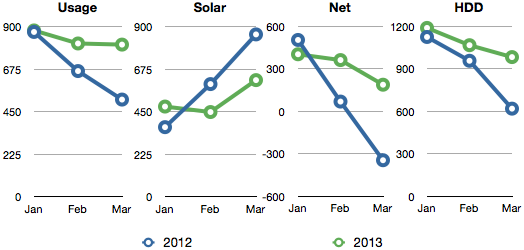
| 2013 | Usage | Solar PV | Net usage or (surplus) | Avg. daily usage | HDD |
|---|---|---|---|---|---|
| Total | 2,499 | 1,546 | 953 | 28.1 | 3,238 |
| Jan | 881 | 478 | 403 | 28.4 | 1,189 |
| Feb | 812 | 449 | 362 | 29.0 | 1,067 |
| Mar | 806 | 618 | 188 | 26.0 | 983 |
| 2012 | Usage | Solar PV | Net usage or (surplus) | Avg. daily usage | HDD |
|---|---|---|---|---|---|
| Total | 2,054 | 1,824 | 228 | 22.6 | 2,701 |
| Jan | 873 | 369 | 504 | 28.2 | 1,125 |
| Feb | 666 | 597 | 69 | 23.0 | 957 |
| Mar | 515 | 860 | (345) | 16.6 | 619 |
Seeing all the increases, I wanted to understand if our 22% increased usage (445 kWh) was due mainly to the 20% increase in colder weather (HDD), or if other factors were leading to our increased electricity usage.
Broadly speaking, hot water, heat and all other circuits (mainly plugs loads and lighting) each accounted for about 30% of the total energy for the 1st quarter. Out of the three, hot water is the only one we can accurately compare because we still lack circuit-level data for Q1 2012.
For the last three months we’ve averaged 74.8 gallons of water per day, up 46% from first quarter 2012. That’s an extra 600 to 800 gallons of water per month, or nearly 24 extra gallons per day. This includes a 25% increase in hot water usage. Although we don’t have circuit-level data on the hot water heater, we do have monthly hot water usage data. We can use this to estimate the energy required to make hot water in Q1 2012.
Our hot water heater used an average of 275.8 watts to heat one gallon of water in Q1 2013 (water heaters have to work harder in the winter). We used an extra 533 gallons of hot water in Q1 2013. 533 * 275.8 = 147 kWh. That’s 33% of the overall usage increase right there.
As for the cause of the increase? To remain happily married I will only say two words, goats and mother-in-law. I don’t think I should say anything more on that topic.
Now let’s look at heating.
Determining the increase in heat energy is not easy to answer because we only have estimated usage values for heat in Q1 2012. Estimated values for heating have a much higher degree of uncertainty. Using this quarter’s values to check the accuracy of my 2012 estimate shows that my estimate may have been off quite a bit. It’s hard to know how much it may be off because I don’t know an easy way to factor in heat gain directly from the sun shining through the windows. Below are the heat pump electric usage values for Q1 2012 and 2013.
| Heat (kWh) | 2012 1 | 2013 | change |
|---|---|---|---|
| Total | 327 | 746 | 128% |
| Jan | 149 | 282 | 89% |
| Feb | 119 | 270 | 127% |
| Mar | 59 | 194 | 229% |
Based on the values in this table, we used an additional 422 kWh or a 128% increase in energy use for heating in 2013. This would almost completely use up the 445 kWh overall usage increase! So I know this can’t be correct. For example, if I use the HDD formula, 0.2261 x 1900 HDD(base 50) + 0.756, I get 430 kWh, which is far below the actual recorded 746 kWh. Which means my estimated heat values for 2012 are off. But we know that heating has increased some amount due to the colder temperatures and cloudier skies. We just can’t determine how much it increased.
So let’s look at all other circuits. Again we can’t really compare apples-to-apples yet, but there are a number of changes that have occurred this year. As I mentioned, we now have a barn full of goats, chickens and other critters. On the coldest days we used heated water buckets to keep the water from freezing. In March we had an egg incubator running for 23 days and and we’re using grow lamps to start our garden seedlings. As of March 30 we’re also now using a 250W heat lamp in the chic brooder. This will last for a few weeks before we switch to a smaller wattage, pushing our energy usage up 4 to 5 times it’s usual base load for about 5-6 weeks. Soon the incubator will be in use again. We’re going to try hatching and raising some turkeys this year.
In summary, Q1 usage is up compared to last year. Some of the reasons for this are fairly obvious, others remain difficult to tease out of the data. Hopefully next quarter will offer better comparisons and we’ll finally be able to compare apples-to-apples with circuit-level data. It should be easier to see where usage has changed and why. If we understand why, then we have a better chance of improving performance over time.
You can see heat maps and detailed charts of temperature and electrical usage at netplusdesign.com. View hourly, daily and monthly values for solar, usage, net usage, temperatures and HDD.

Categories
- Air sealing 13
- Appliances & Fixtures 4
- Art 3
- Award 4
- Bathroom 8
- Batteries 1
- Decor 5
- Design 10
- Electrical 5
- Energy Calculations 13
- Energy Monitors 4
- Farm 1
- Finance 1
- Flooring 3
- Foundation 9
- Framing 8
- Heating 9
- House 7
- Insulation 8
- Kitchen 6
- Landscaping 3
- Lessons Learned 1
- Performance 60
- Plumbing 10
- Porch 5
- Radon 1
- Rainwater catchment 3
- Research / study 1
- Roof 7
- Septic / Waste water 2
- Sheetrock 6
- Siding 9
- Site Work 22
- Smart home 1
- Solar 64
- Solar Obsessed 10
- Stairs 2
- Surveying 3
- Ventilation 8
- Weather 1
- Windows & Doors 14
- plug-in 3
Archive
- Jan 2021 1
- Dec 2020 2
- May 2020 1
- Jan 2020 1
- May 2019 1
- Jan 2019 3
- Sep 2018 2
- Aug 2018 2
- Jan 2018 1
- Oct 2017 2
- Apr 2017 1
- Jan 2017 1
- Oct 2016 2
- Aug 2016 1
- Apr 2016 2
- Jan 2016 2
- Nov 2015 2
- Oct 2015 1
- Jul 2015 1
- May 2015 1
- Apr 2015 1
- Jan 2015 1
- Dec 2014 1
- Nov 2014 2
- Oct 2014 4
- Sep 2014 2
- Aug 2014 1
- Jul 2014 1
- Mar 2014 3
- Feb 2014 2
- Jan 2014 2
- Nov 2013 1
- Oct 2013 1
- Sep 2013 1
- Jul 2013 3
- Apr 2013 3
- Jan 2013 3
- Dec 2012 2
- Nov 2012 3
- Oct 2012 1
- Sep 2012 3
- Aug 2012 3
- Jul 2012 2
- Jun 2012 1
- May 2012 3
- Apr 2012 2
- Mar 2012 4
- Feb 2012 4
- Jan 2012 5
- Dec 2011 4
- Nov 2011 9
- Oct 2011 10
- Sep 2011 9
- Aug 2011 6
- Jul 2011 6
- Jun 2011 12
- May 2011 8
- Apr 2011 4
- Mar 2011 5
- Jan 2011 6
- Dec 2010 9
- Nov 2010 3
- Oct 2010 4
- Sep 2010 6
- Aug 2010 8
- Jul 2010 6
- Jun 2010 3
- May 2010 3
- Apr 2010 1
- Mar 2010 3
- Feb 2010 3
- Dec 2009 1
- Jun 2009 1
- May 2009 1
- Feb 2009 1
- Dec 2008 1
- Nov 2008 1
- Jun 2008 1