I’ve been slacking on the energy updates. I love my new energy monitor, but it broke my database update scripts and I haven’t had time to fix them. In the mean time I thought I’d share some high level updates.
1. Transition from eMonitor to eGauge data begins March 8. Missing data for about 4 hours.
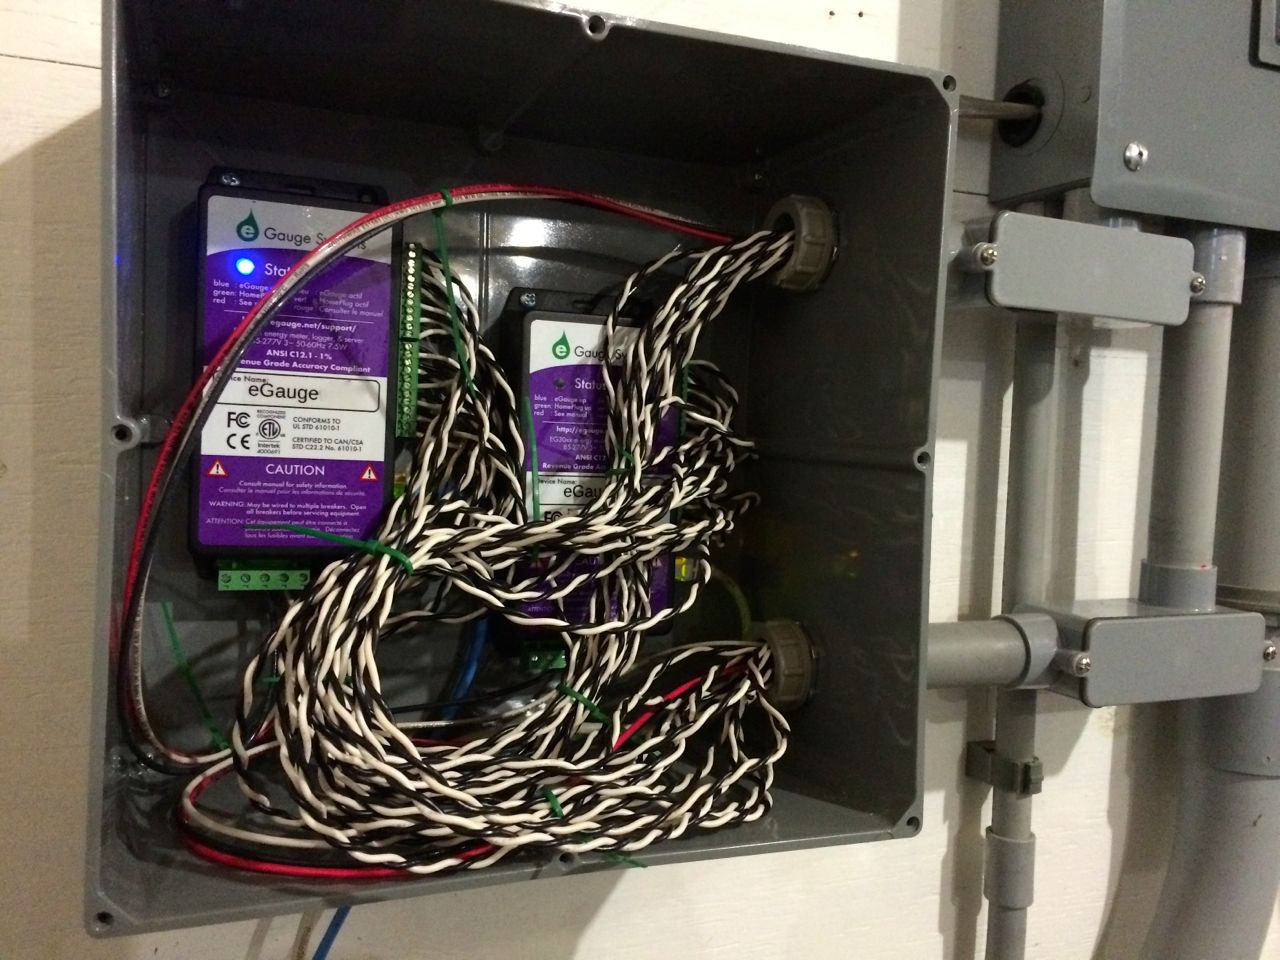
As you can see in the photo above, we have 2 new eGauges. Each monitors up to 12 circuits, for a total of 24. When you count 2 lines in, solar and several circuits that have double breakers pulling unbalanced loads, that ends up covering 20 individual things we can now monitor. We were previously monitoring only 7 circuits plus solar and power from the utility.
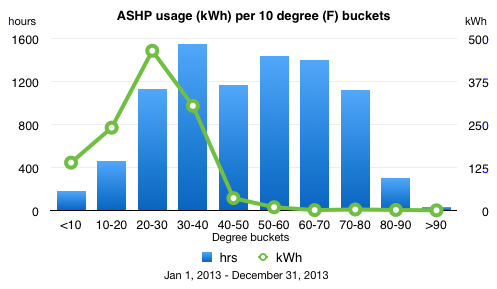
Living in a super-insulated house, I get very excited when extreme cold weather arrives. It is the only way to see how well the house performs in low temperatures. This January was the coldest month that we’ve lived in the house.
Q4 2013 summary: 10% cooler, 22% more usage and 10% more sun as compared to Q4 2012.
Now that we are starting to collect our second year of performance data, I’ll be comparing our new data to the same period last year. Year-over-year comparisons should be more illustrative than comparing to previous months. I’m also switching to a quarterly reporting period to look for larger trends, but I will continue to post data monthly at netplusdesign.com
In Q4 last year our total usage was 1,599 kWh. This year is was 1,957 kWh, a 22% increase. Despite snow covering the collectors for a few days and cloudy weather, we still produced 10% more energy in Q4.
Overall, here’s how this quarter and the year compare to 2012.
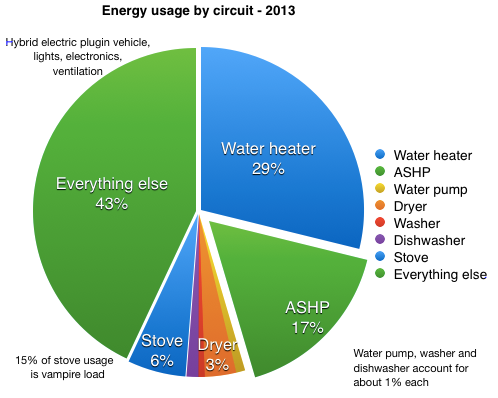
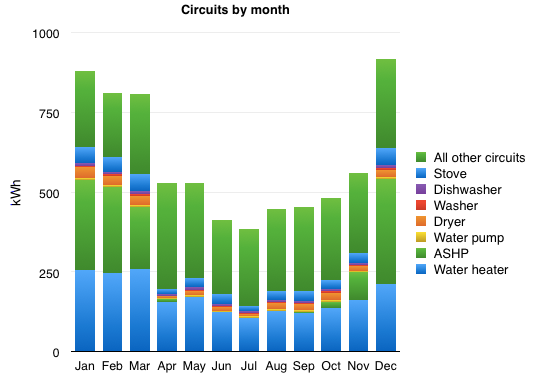
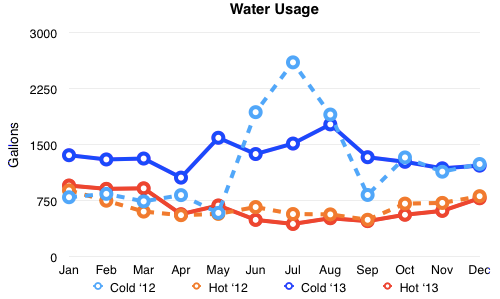
Pie chart of energy usage by circuit 2013Stacked bar chart of energy usage by month 2013Chart of monthly temperature ranges 2013Chart of temperature buckets with ASHP usage overlay 2013Chart of water usage 2013Read more...