
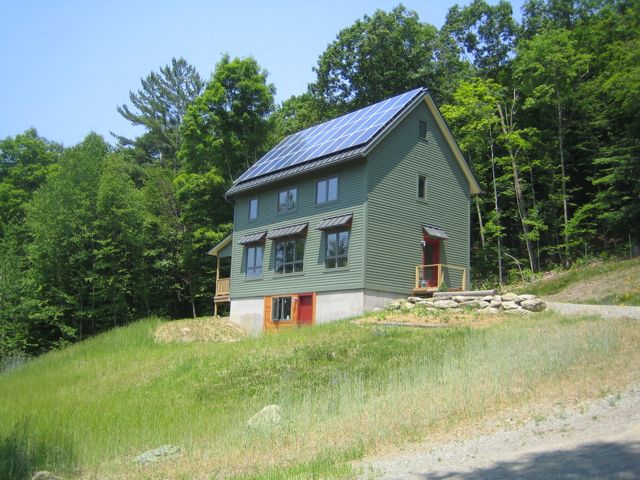
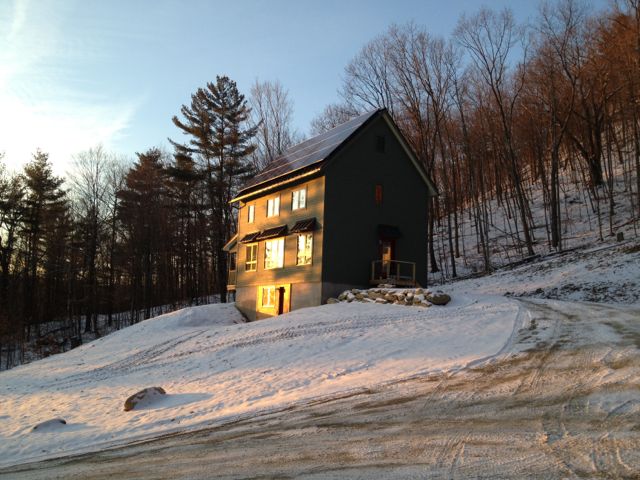
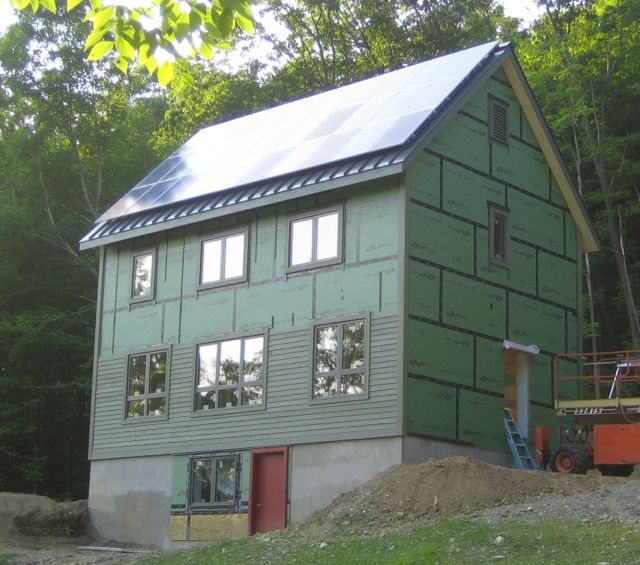
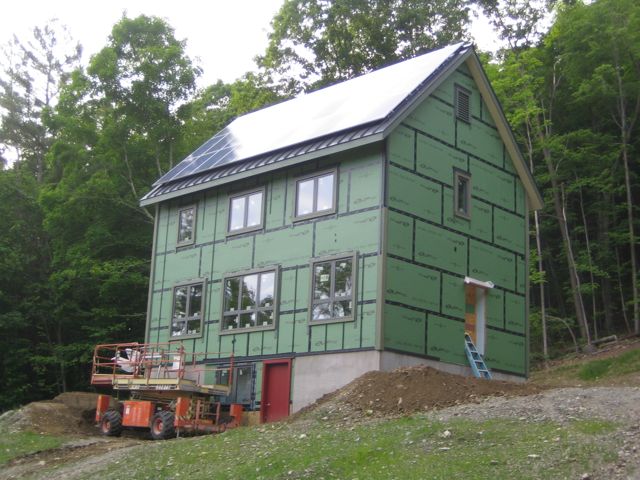
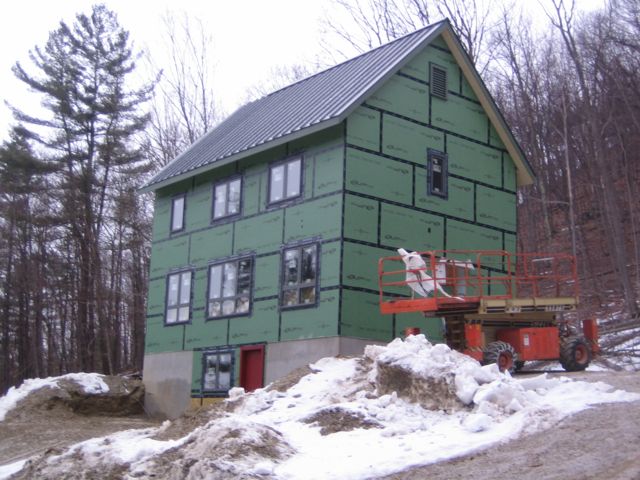
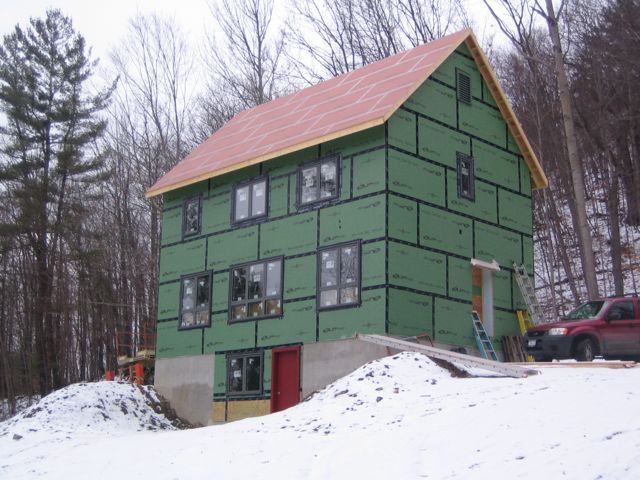
Up Hill House - page 7 of 23
-
Estimating heat energy for 2012
April 7 Update: Using a different method I estimated that we used 903 kWh for heat energy in 2012, that’s 16% of our total energy use. That would have cost us about $117 (using $0.13 per kWh).
We don’t have a full 12 months of data for our heat, but using heating degree days (HDD) and performance thus far we can estimate that we used 591 kWh (+/-20%) for heat in 2012. That’s 11% of our total energy use for the year.
Here’s the math…
Read more... -
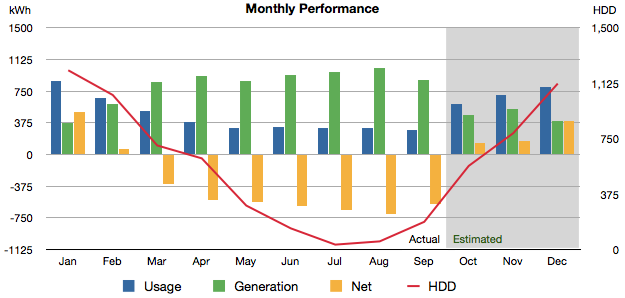
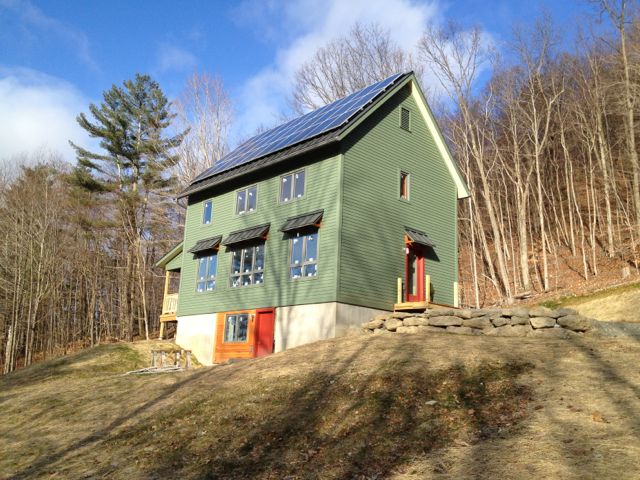
We're net positive for 2012!
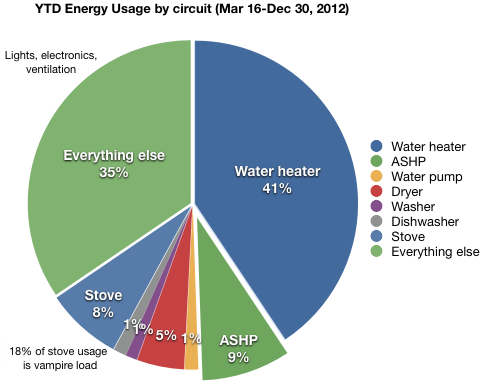
Pie chart showing circuit usage YTD 
Bar chart showing circuit usage per month Year Summary
We’re net positive for 2012! We used 5,601 kWh and generated 8,856 kWh for a net surplus of 3,256 kWh. We used an average of 15.3 kWh per day.
Read more... -
Home Performance App Upgrade
I’ve updated our home performance app at, NetPlusDesign.com.

Screenshot from new app. At the beginning of the year I put together a simple online tool that displays our energy and temperature data on a daily and hourly basis. It gave me an easier way to track and visualize our energy usage on a month to month basis without a bunch of spreadsheet work. The heat maps provide an easy way to quickly find days of high energy use and see what else was going on that day. This helps me understand why usage might be high on a particular day.
Read more... -
November performance
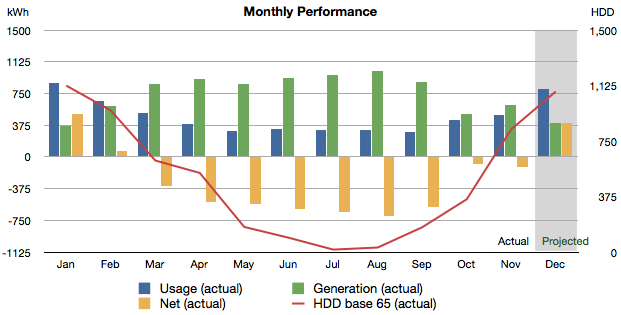
Chart showing monthly usage, generation, net and hdd We used 498 kWh and generated 615 kWh for a net surplus of 117 kWh in November. This is our ninth consecutive surplus month. We’ve generated a surplus of 3,622 kWh so far this year, guaranteeing we’ll be net positive for our first year of operation.
Read more... -
Temperature and energy use observations
As I continue sifting through our performance data, I’ve been focusing lately on outdoor temperatures and their relationship with our heating and cooling energy use. These are a few of my observations.
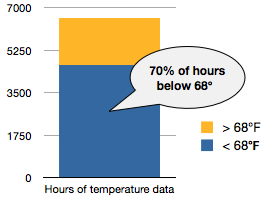
70 percent of time period was below 68 degrees We have 9 months, 274 days, 6,576 hours of temperature data, from February 1 to October 31. Of those 6,576 hours, 4,635 outdoor temperature hours were below 68 degrees F. Roughly 70% of the recorded time period has been below 68 degrees F.
Read more... -
Correlating HDD with heating energy use
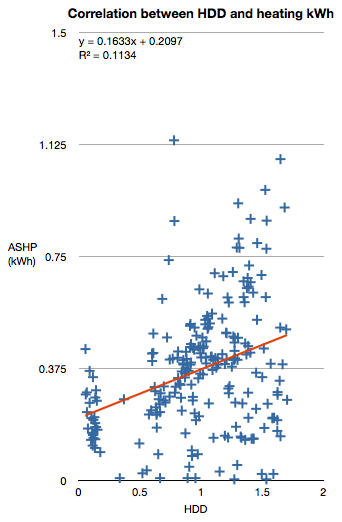
Chart showing poor correlation between HDD and heat energy use I spent a few of the Sandy storm days indoors and decided to indulge my inner nerd. I’ve been tracking all our house performance data using monthly spreadsheets, which can make it difficult to filter data or look for trends across months. So I downloaded mySQL and imported all our energy and temperature data into the database. This is the first in a series of posts on what I find as I sift through the data.
Read more... -
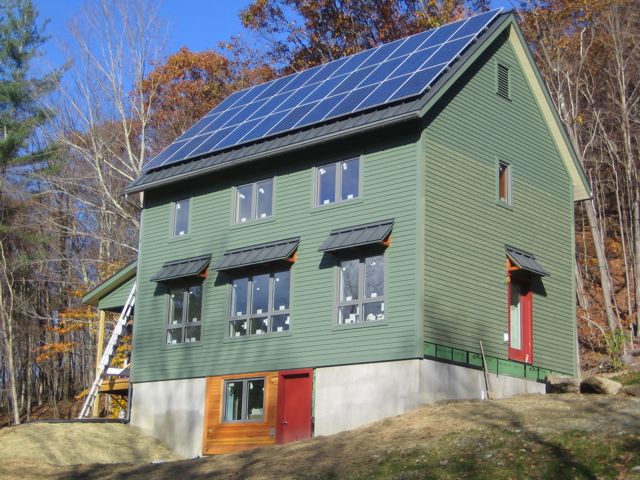
October performance
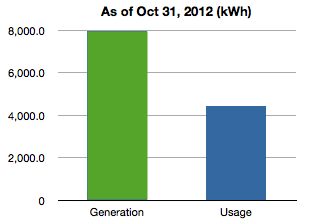
Total usage vs production in kWh as of Oct 31 October was overshadowed by the events of the last week. Despite the best efforts of Hurricane Sandy we are safe and dry at Up Hill House. We had plenty of strong wind gusts, but not nearly as bad as the costal regions. We were prepared for the worst. We stocked up on water and easy to prepare meals. We have a small propane burner that can be used to heat water or simple cooking. We packed the chest freezer with ice. We filled the bathtub for flushing and the cistern was full for the farm critters. Thankfully the power never went out.
Read more... -
September performance
performance chart september Fall weather arrived last month. More rain and clouds with cooler nights. We generated 883 kWh in September, down 15% from last month, but still about 37 kWh better than predicted. We generated on average 29.4 kWh per day.
We used 292 kWh, our lowest month yet. That’s down 7% from the previous month. We used the air conditioning only 2 days and heating for 1 day. We used 9.5 kWh for cooling / dehumidification, and 5.9 kWh for heating. Together that’s 5% of our month’s total usage. We generated a 591 kWh surplus this month, our 7th surplus month in a row.
I changed the format of the table a bit. Months now run down the table instead of across.
Read more... -
NY State SREC Update
I follow the SRECTrade blog for New York related solar news. You can find the latest update here. It contains this bit of unwelcome news.
Read more... -
Green Building Open House 2012 Reminder
Just a reminder. The Green Building Open House Tour, sponsored by NESEA, and the National Solar Tour, sponsored by the American Solar Energy Society, is October 13 this year from 10 to 4.
Read more...

Categories
- Air sealing 13
- Appliances & Fixtures 4
- Art 3
- Award 4
- Bathroom 8
- Batteries 1
- Decor 5
- Design 10
- Electrical 5
- Energy Calculations 13
- Energy Monitors 4
- Farm 1
- Finance 1
- Flooring 3
- Foundation 9
- Framing 8
- Heating 9
- House 7
- Insulation 8
- Kitchen 6
- Landscaping 3
- Lessons Learned 1
- Performance 60
- Plumbing 10
- Porch 5
- Radon 1
- Rainwater catchment 3
- Research / study 1
- Roof 7
- Septic / Waste water 2
- Sheetrock 6
- Siding 9
- Site Work 22
- Smart home 1
- Solar 64
- Solar Obsessed 10
- Stairs 2
- Surveying 3
- Ventilation 8
- Weather 1
- Windows & Doors 14
- plug-in 3
Archive
- Jan 2021 1
- Dec 2020 2
- May 2020 1
- Jan 2020 1
- May 2019 1
- Jan 2019 3
- Sep 2018 2
- Aug 2018 2
- Jan 2018 1
- Oct 2017 2
- Apr 2017 1
- Jan 2017 1
- Oct 2016 2
- Aug 2016 1
- Apr 2016 2
- Jan 2016 2
- Nov 2015 2
- Oct 2015 1
- Jul 2015 1
- May 2015 1
- Apr 2015 1
- Jan 2015 1
- Dec 2014 1
- Nov 2014 2
- Oct 2014 4
- Sep 2014 2
- Aug 2014 1
- Jul 2014 1
- Mar 2014 3
- Feb 2014 2
- Jan 2014 2
- Nov 2013 1
- Oct 2013 1
- Sep 2013 1
- Jul 2013 3
- Apr 2013 3
- Jan 2013 3
- Dec 2012 2
- Nov 2012 3
- Oct 2012 1
- Sep 2012 3
- Aug 2012 3
- Jul 2012 2
- Jun 2012 1
- May 2012 3
- Apr 2012 2
- Mar 2012 4
- Feb 2012 4
- Jan 2012 5
- Dec 2011 4
- Nov 2011 9
- Oct 2011 10
- Sep 2011 9
- Aug 2011 6
- Jul 2011 6
- Jun 2011 12
- May 2011 8
- Apr 2011 4
- Mar 2011 5
- Jan 2011 6
- Dec 2010 9
- Nov 2010 3
- Oct 2010 4
- Sep 2010 6
- Aug 2010 8
- Jul 2010 6
- Jun 2010 3
- May 2010 3
- Apr 2010 1
- Mar 2010 3
- Feb 2010 3
- Dec 2009 1
- Jun 2009 1
- May 2009 1
- Feb 2009 1
- Dec 2008 1
- Nov 2008 1
- Jun 2008 1