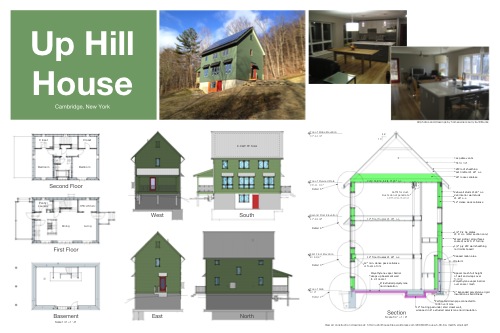
We submitted our entry materials for the NESEA Zero Net Energy Building Award yesterday. We didn’t quite have a full year’s worth of data for last year’s competition. So we were excited to apply this year. You can find out more about the requirements for the competition on the NESEA site.
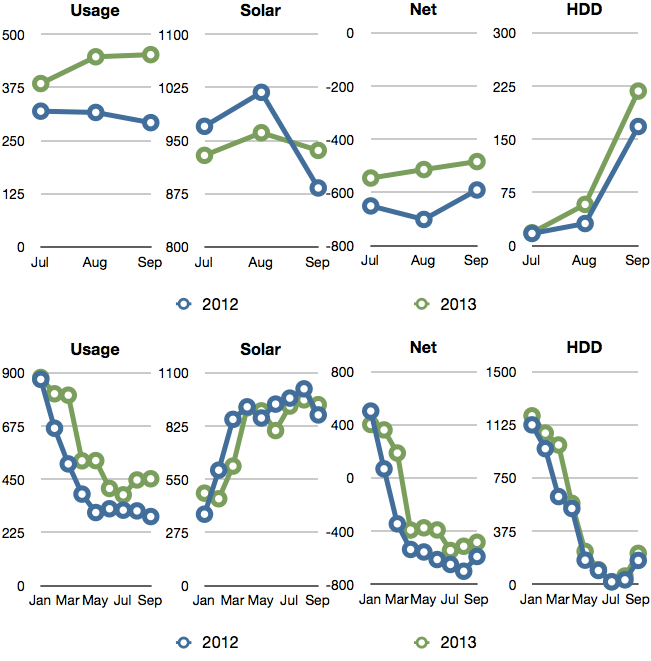
Q3 2013 summary: 36% cooler, 38% more usage and 2% less sun as compared to Q3 2012.
Now that we are starting to collect our second year of performance data, I’ll be comparing our new data to the same period last year. Year-over-year comparisons should be more illustrative than comparing to previous months. I’m also switching to a quarterly reporting period to look for larger trends, but I will continue to post data monthly at netplusdesign.com
In Q3 last year our total usage was 927 kWh. This year is was 1,283 kWh, a 38% increase. Although it feels like it had rained a lot more this year then last, we only produced 2% less energy in Q3.
Overall, here’s how this quarter and the first three quarters compare to 2012.
If you remember one of our early solar posts when building the house, we initially assumed that solar was going to be too expensive for us. Then we ran the numbers and found that the rate of return was actually quite attractive over the log run.
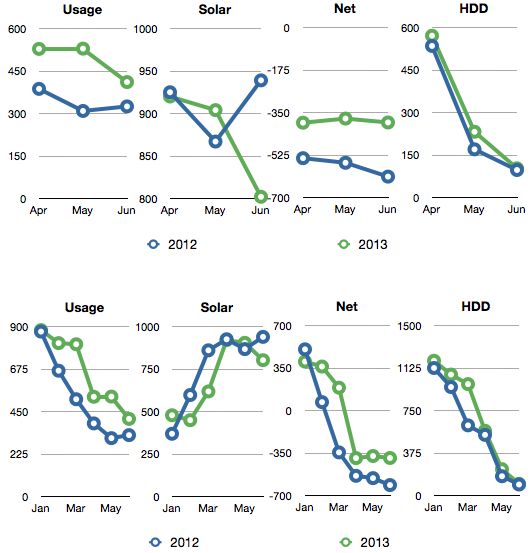
Q2 2013 summary: 13% colder, 44% more usage and 4% less sun.
Now that we are starting to collect our second year of performance data, I’ll be comparing our new data to the same period last year. Year-over-year comparisons should be more illustrative than comparing to previous months. I’m also switching to a quarterly reporting period to look for larger trends, but I will continue to post data monthly at netplusdesign.com
In Q2 last year our total usage was 1,021 kWh. This year is was 1,468 kWh, a 44% increase. Although it feels like it had rained a lot more this year then last, we only produced 4% less energy in Q2.
Overall, here’s how the first and second quarters compare to 2012.
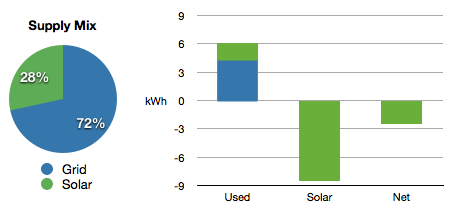
In the last year (April 1, 2012 to March 31, 2013), we used 6,046 kWh of electricity and produced 8,576 kWh for a net surplus of 2,530 kWh. That’s awesome right?
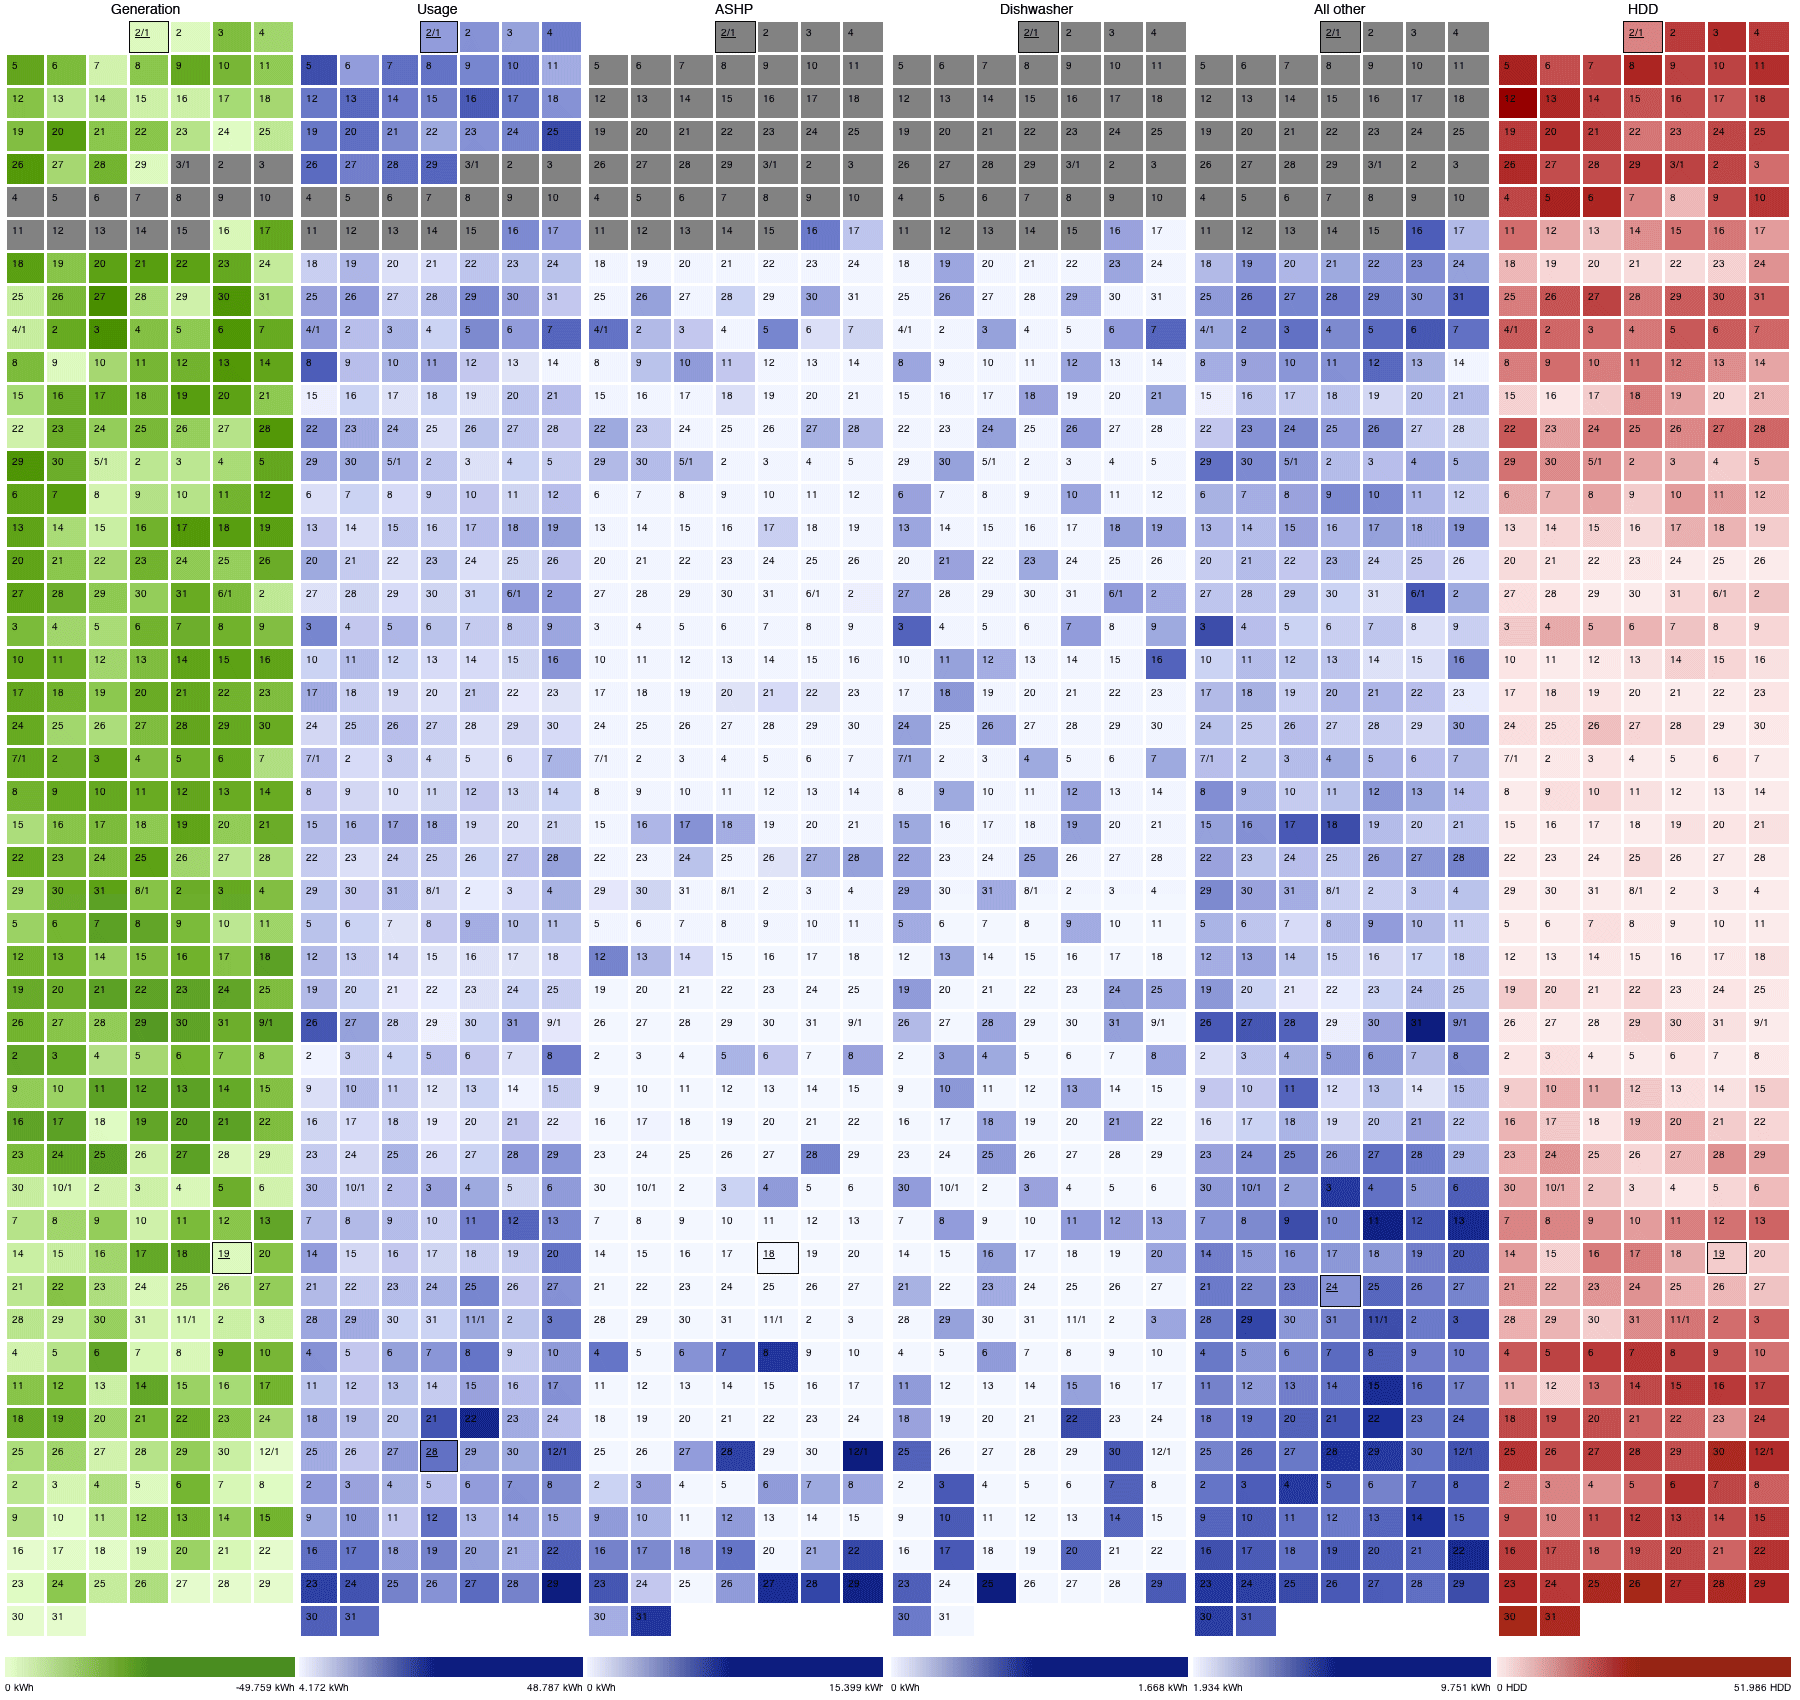
Now that we have January - March 2013 circuit-level usage values, I thought I’d go back and revisit my original 2012 heat estimate using a different method.
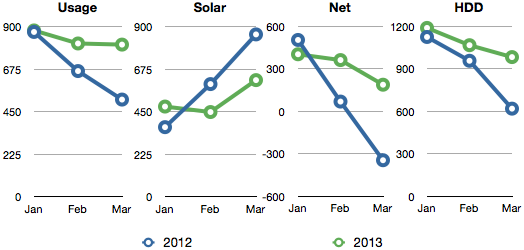
Q1 2013 summary: 20% more cold, 22% more usage and 15% less sun.
Now that we are starting to collect our second year of performance data, I’ll be comparing our new data to the same period last year. Year-over-year comparisons should be more illustrative than comparing to previous months. I’m also switching to a quarterly reporting period to look for larger trends, but I will continue to post data monthly at netplusdesign.com
In Q1 last year our net usage was 228 kWh. This year is was 953 kWh, a 300% increase! In March 2012 we actually generated a surplus, but not this year.
Overall, here’s how the first quarter compares to 2012.