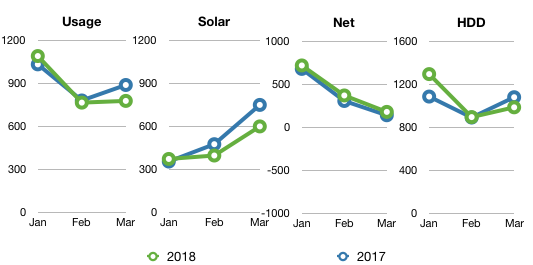
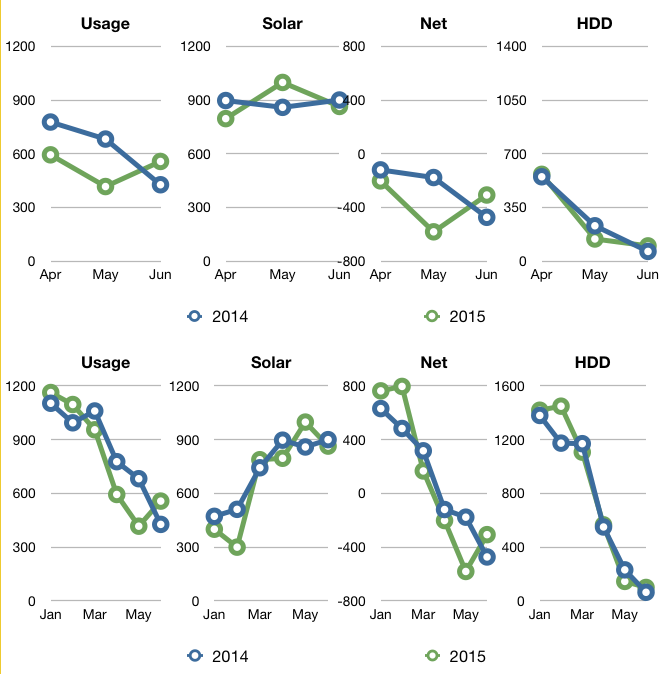
Q1 2018 summary: 4% colder, 3% less usage and 13% less sun as compared to Q1 2017.
This is part of our quarterly home performance reporting. All data is posted at netplusdesign.com
I said it last year and I’ll say it again, it was a whacky winter. Lots of cold days, but also lots of warm days. It would be warm for a week or two, the ground would thaw, then we’d get snow.
We recorded a low of -17.1 on January 7, close to our lowest recorded temperature of -17.3°F on February 14, 2016. Our high was 77.6, higher than the 73.6°F last year. In 2012 we recorded a high of 82.4°F in the same period.
Overall, here’s how this quarter compared to 2017.
We used 7,198 kWh and generated 7,966 kWh for a net of 769 kWh for the year.
This is part of our quarterly home performance reporting. All data is posted at netplusdesign.com
2016 was our second highest net energy surplus year after 2012 and our highest solar generation year.
2017 was our second lowest net energy surplus year after 2014 and our lowest solar generation year over the last 6 years. We had a lot of cloudy days and snow covered panels.
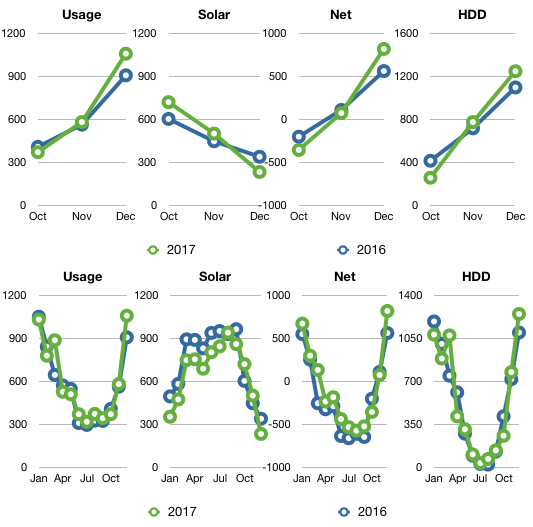
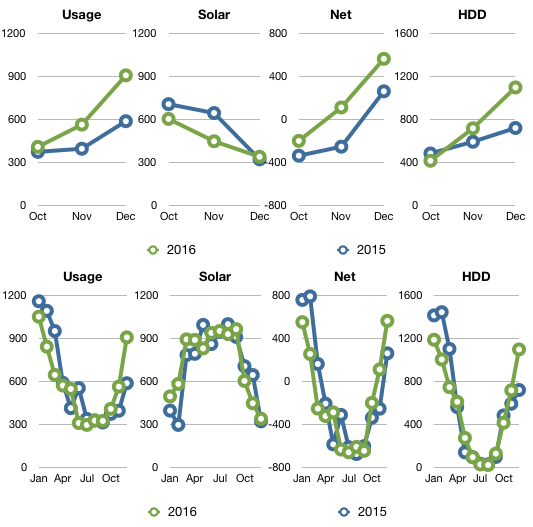
Q4 2017 summary: 2% colder, 7% more usage and 5% more sun as compared to Q4 2016.
In Q4 our total usage was 2,022 kWh, a 7% increase from our 1,890 kWh in 2016. We also generated 65 kWh more solar.
Overall, here’s how this quarter and the year compare.
Charts comparing Q4 and YOY usage, solar and HDDRead more...
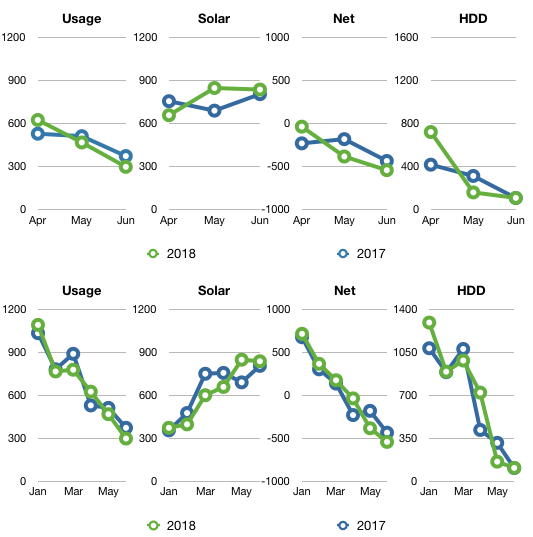
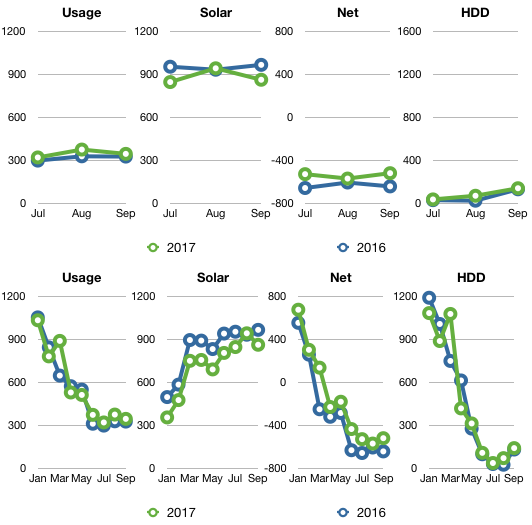
Q3 2017 summary: 33% cooler, 9% more usage and 7% less sun as compared to Q3 2016.
This is part of our quarterly home performance reporting. All data is posted at netplusdesign.com
Nothing exciting to report, which is normal for 3rd quarters.
At 1pm on July 17th we became net positive for the year. As of the end of September, we have a surplus of 1,326 kWh heading into the final months of 2017. That’s about 574 less kWhs than last year at this time. Overall for the year, our solar production is down about 13%.
Overall, here’s how this quarter compared to 2016.
Chart showing usage, solar, net and hddRead more...
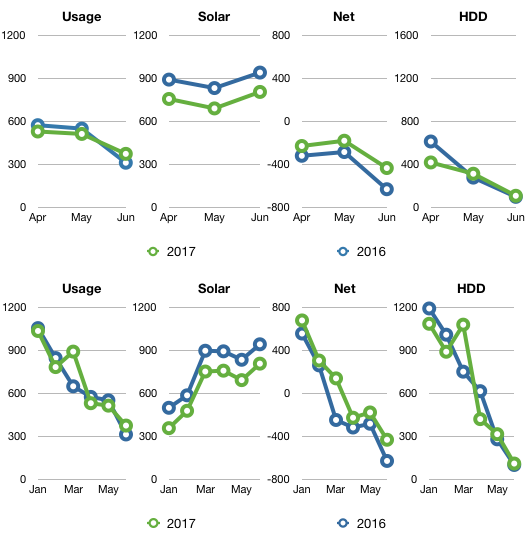
Q1 2017 summary: 3% colder, 6% more usage and 20% less sun as compared to Q1 2016.
This is part of our quarterly home performance reporting. All data is posted at netplusdesign.com
I’ll say it, it was a whacky winter. Lots of cold days, but also lots of warm days. It would be warm for a week or two, the ground would thaw, then we’d get snow.
We recorded a low of 3.3, quite a bit warmer than the -17.3°F last year’s low. Our high was 73.6, less than the 78.5°F last year. In 2012 we recorded a high of 82.4°F in the same period.
Overall, here’s how this quarter compared to 2016.
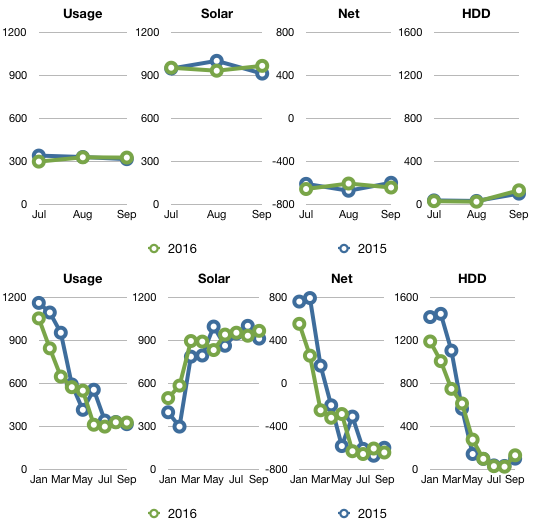
Q3 2016 summary: 10% cooler, 3% less usage and about the same amount of sun as compared to Q3 2015.
This is part of our quarterly home performance reporting. All data is posted at netplusdesign.com
Nothing exciting to report, which is normal for 3rd quarters.
At 7am on May 31st we became net positive for the year. As of the end of September, we have a surplus of 1,900 kWh heading into the final months of 2016.
Overall, here’s how this quarter compared to 2015.
Chart showing usage, solar, net and hddRead more...


